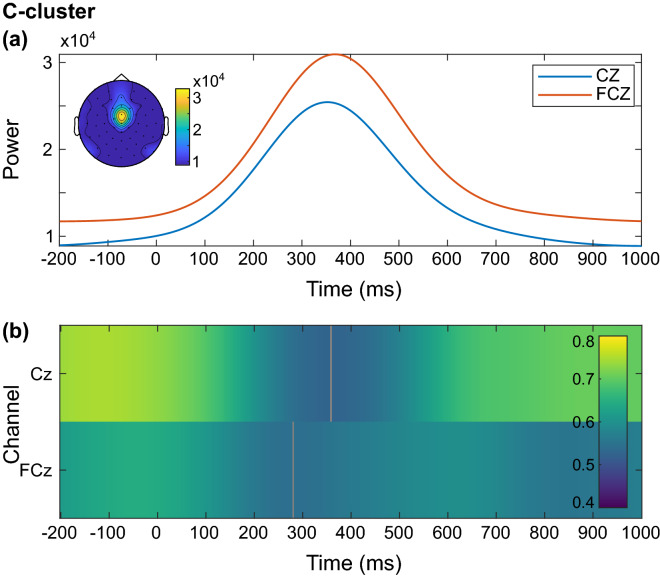
Figure 5.
Time course of total theta power and correlation between resting and inhibition-related theta power in the C-cluster. (a) Participants’ grand average showing the course of inhibition-related total theta power in the frequency band of 5 Hz in the C-cluster from 200 ms before stimulus onset to 1000 ms after the stimulus onset at electrodes Cz (blue) and FCz (orange). The scalp topography corresponds to the time–frequency window of 367 ms and 5 Hz. (b) Correlation between resting-state theta activity and inhibition-related total theta activity in the C-cluster from 200 ms before stimulus onset to 1000 ms after stimulus onset for the electrodes Cz and FCz. Only significant correlations with p ≤ .05 after a channel-by-channel correction with the false discovery rate (FDR) method are shown. The grey areas were not significant after FDR correction. The correlation coefficient r is indicated by color.

