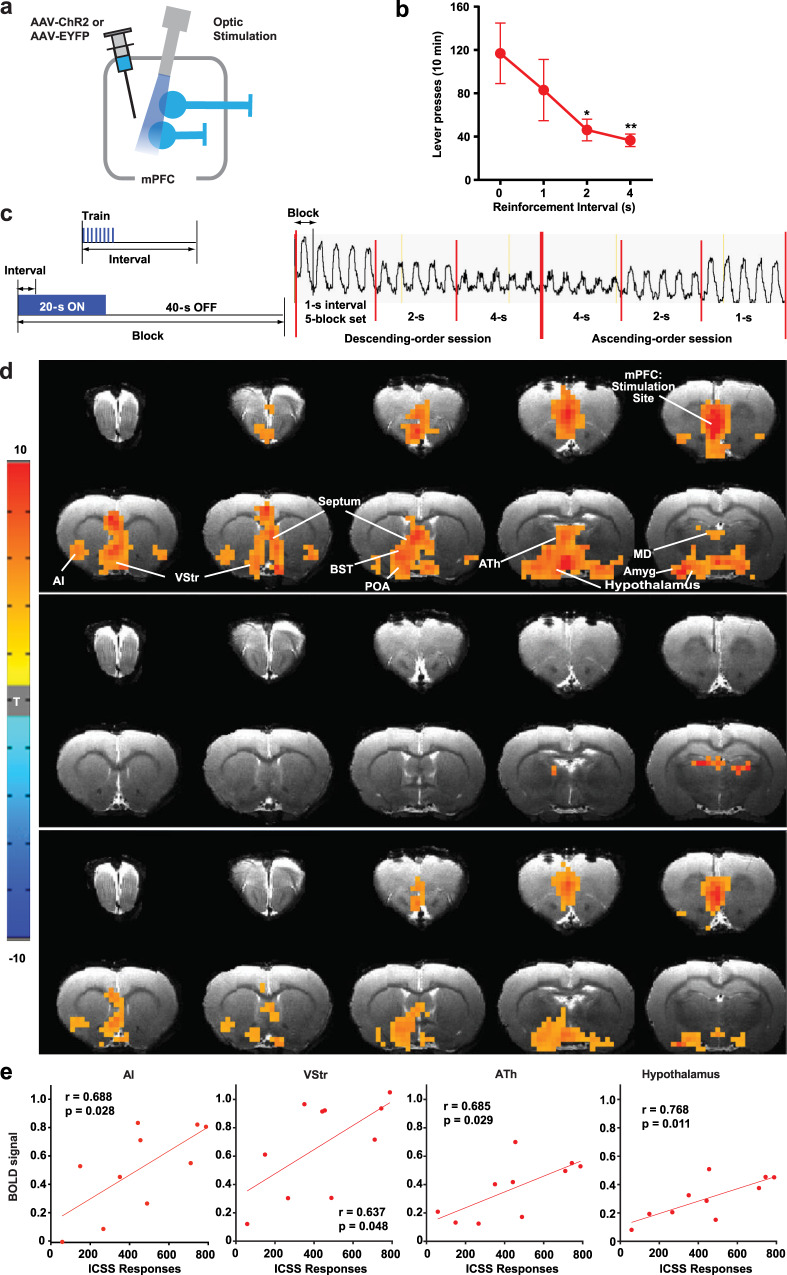
Fig. 3. mPFC stimulation increases fMRI BOLD signals in downstream regions.
a Each rat received AAV-ChR2-EYFP or AAV-EYFP injected into the IL followed by the implantation of an optic fiber at the same region. b ICSS: The rats (n = 7) received photostimulation (a train of 8 pulses at 25 Hz) upon lever pressing. After a stable response over a few sessions, the effects of the reinforcement interval (0, 1, 2, and 4 s) were evaluated with a within-subjects design in that order. Each interval was tested in a 10-min block. Data are mean lever-presses (±SEM). *P = 0.0319, **P = 0.0135, significantly lower than the continuous-reinforcement schedule (0 s) value (Tukey HSD post hoc test). c fMRI: Photostimulation (a train of 8 pulses at 25 Hz) delivered at the IL with one of three intervals (1, 2, or 4 s) during the 20-s ON phase of a 60-s block. Each block was repeated 5 times for each train interval. Effects of reinforcement intervals were determined in both descending- and ascending-order sessions. The vertical axis indicates raw BOLD signal intensity of one mPFC voxel in arbitrary unit. d The unilateral photostimulation with the 1-s interval activated the entire medial network of the PFC, including the medial orbital, prelimbic, ventral anterior cingulate, and infralimbic regions, with stimulation-side dominance. It also elicited significant BOLD signals in extensive subcortical regions of the mPFC (top; n = 10), but limited signals in the control group (middle; n = 7). Significant differences in BOLD signal between the ChR2 and control groups are shown in the bottom panel. Imaging results were corrected for whole-brain multiple comparisons (Corrected P < 0.05). AI anterior insular region, Amyg amygdala, ATh anterior thalamic area, BST bed nucleus of stria terminalis, MD mediodorsal region, POA preoptic area, VP ventral pallidum, VStr ventral striatum. e Significant correlations (Pearson’s r) between ICSS responses and the levels of BOLD signals in the AI, VStr, ATh, and hypothalamus. Each dot represents the data of a single rat.

