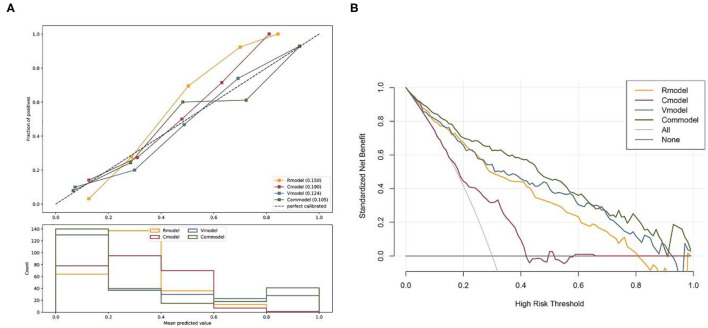
Figure 6.
(A) Calibration curves of the Rmodel, Cmodel, Vmodel, and Commodel. (B) The decision curve analysis for the Rmodel, Cmodel, Vmodel, and Commodel. The decision curve analysis showed that the Commodel had the highest overall net benefit ratio compared with the Rmodel, Cmodel, and Vmodel. Rmodel, radiomics signature model; Cmodel, clinical model; Vmodel, the model based on volume values; Commodel, the model combined with both radiomic features and volume information.

