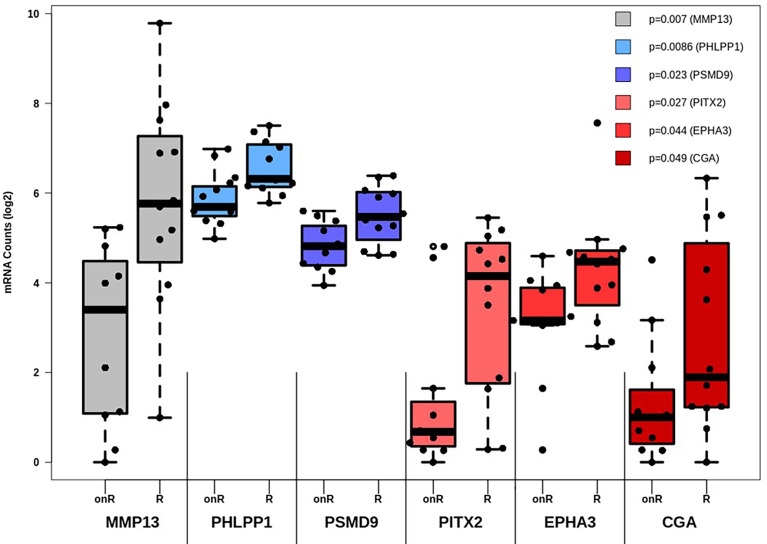
Figure 3.
Differential expression analysis of genes affecting therapy outcome. For each gene the number of measured counts were compared between patients still responding to therapy (Ongoing Response, “onR”) or not (Resistant, “R”). Group-based expression differences were visualized by p-value, which was calculated by Wilcoxon Mann-Whitney rank sum test.

