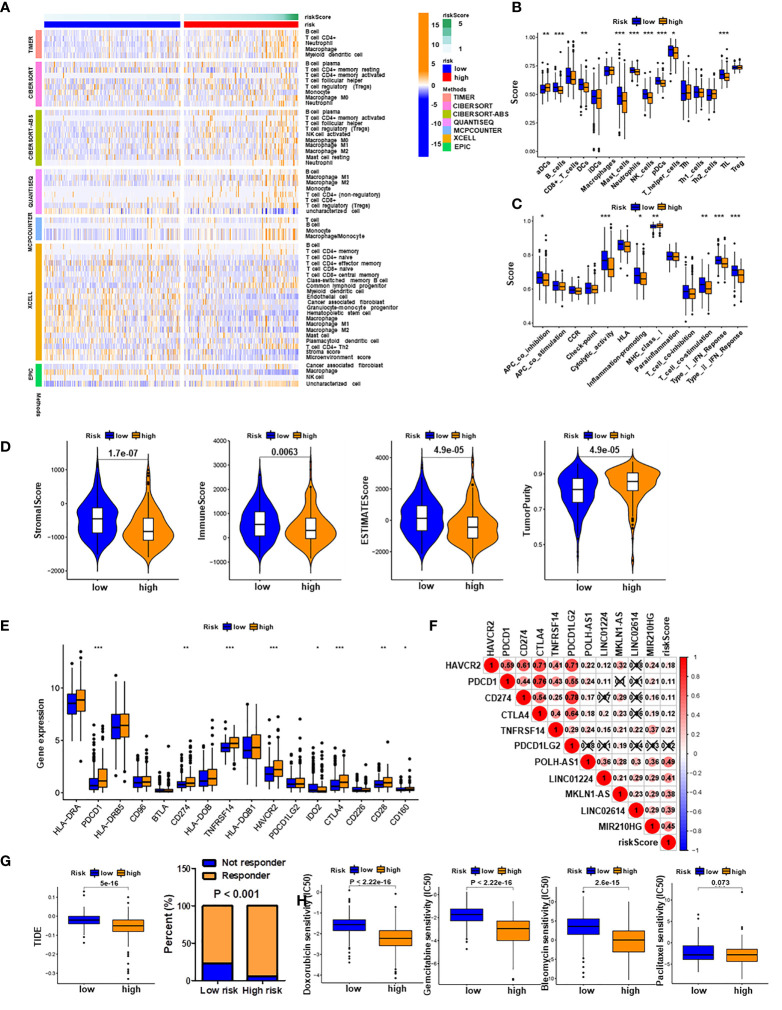
Figure 8.
Immune infiltration analysis and prediction of immunotherapy and chemotherapy response. (A) Heatmap of all significantly differential immune responses between high- and low-risk groups based on TIMER, CIBERSORT, CIBERSORT-ABS, QUANTISEQ, MCPCOUNTER, XCELL, and EPIC algorithms. Immune cell scores (B) and immune function scores (C) in high- and low-risk groups based on ssGSEA algorithm. (D) Comparison of stromal scores, immune scores, estimate scores, and tumor purity between HCC patients in high- and low-risk groups. (E) Expression levels of immune checkpoint genes in high- and low-risk groups. (F) Associations of PRlncSig score with pyroptosis-related lncRNAs and immune checkpoint genes. (G) Comparison of TIDE prediction scores (left) and response to immunotherapy (right) between the high- and low-risk groups in the TCGA_LIHC dataset. (H) Assessment of sensitivity to several chemotherapeutics (doxorubicin, gemcitabine, bleomycin, and paclitaxel in the high- and low-risk groups. *P < 0.05, **P < 0.01, ***P < 0.001.

