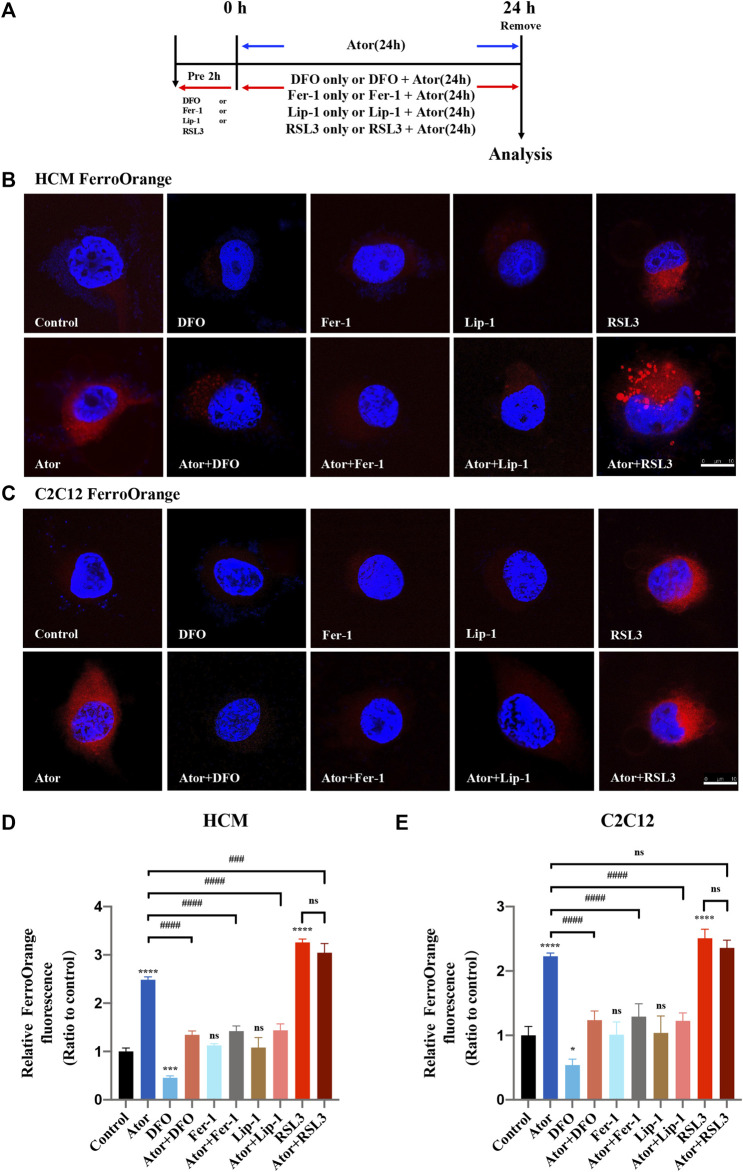
FIGURE 2.
Iron accumulation in atorvastatin-supplemented HCM and C2C12 cells. (A) Experimental workflow. The muscular cells were pretreated with 100 μM DFO, 1 μM Fer-1, 1 μM Lip-1 or 0.5 μM RSL3 for 2 h and then intervened with or without 40 μM atorvastatin for another 24 h, or treated with 40 μM atorvastatin alone for 24 h. (B) Representative images of HCM treated by atorvastatin alone or with ferroptosis inhibitors DFO, Fer-1 and Lip-1 stained with FerroOrange, an indicator of intracellular Fe2+. (C) Representative images of C2C12 stained with FerroOrange. (D) Quantification of relative fluorescence intensity of FerroOrange in HCM. (E) Quantification of relative fluorescence intensity of FerroOrange in C2C12. Fluorescence intensity was quantified by ImageJ software. The data are shown as mean ± SD. ns, no significant; *p < 0.05, ***p < 0.001, ****p < 0.0001 vs. the control group; ### p < 0.001, #### p < 0.0001 vs. the atorvastatin group. n = 3. Scale bar: 10 μm.

