
FIGURE 3.
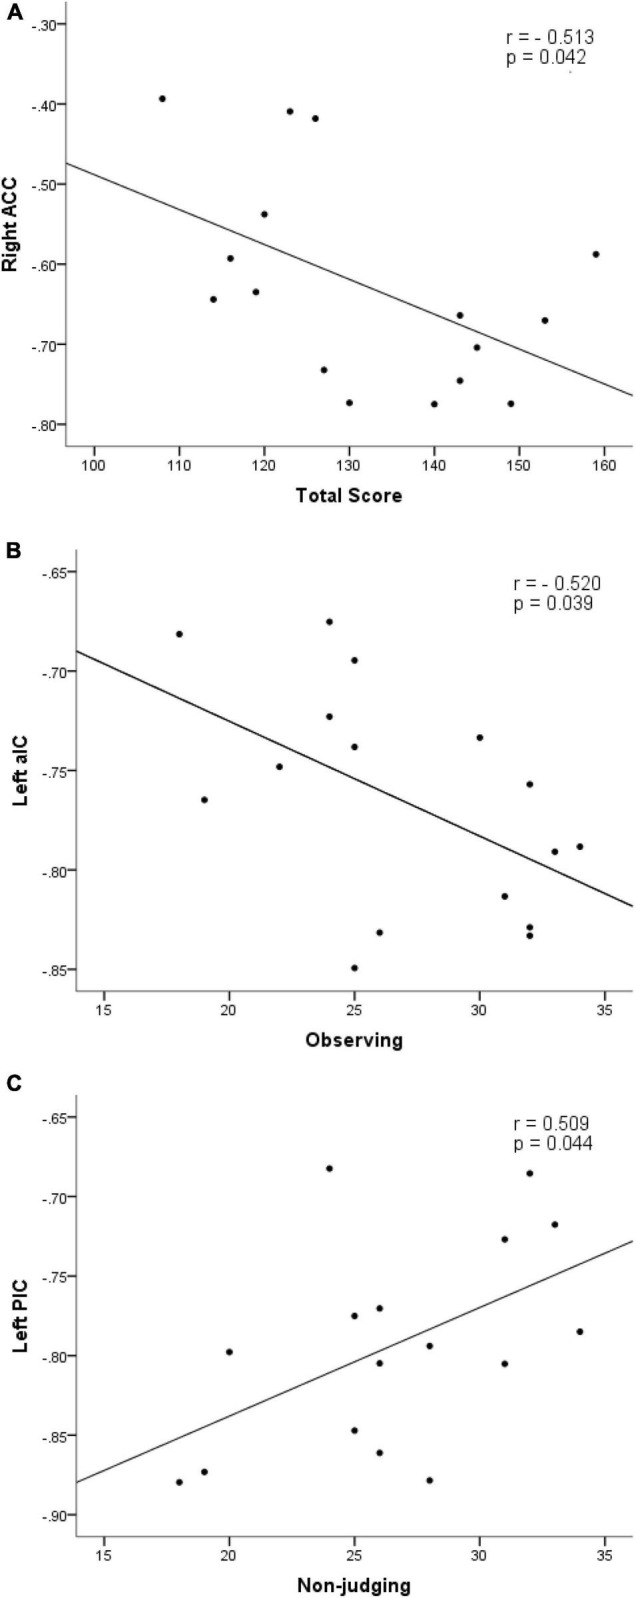
Scatter plot diagrams. The plots and fitted lines indicate: inverse correlations between the ALFF values of ROIs in right anterior cingulate cortex and aIC.L cortex with the total score (r = –0.513, p = 0.042) (A) and observing score (r = –0.520, p = 0.0392) (B); a positive correlation between the ALFF value of posterior insula (pIC) and non-judgment score (r = 0.509, p = 0.044) (C) of FFMQ.