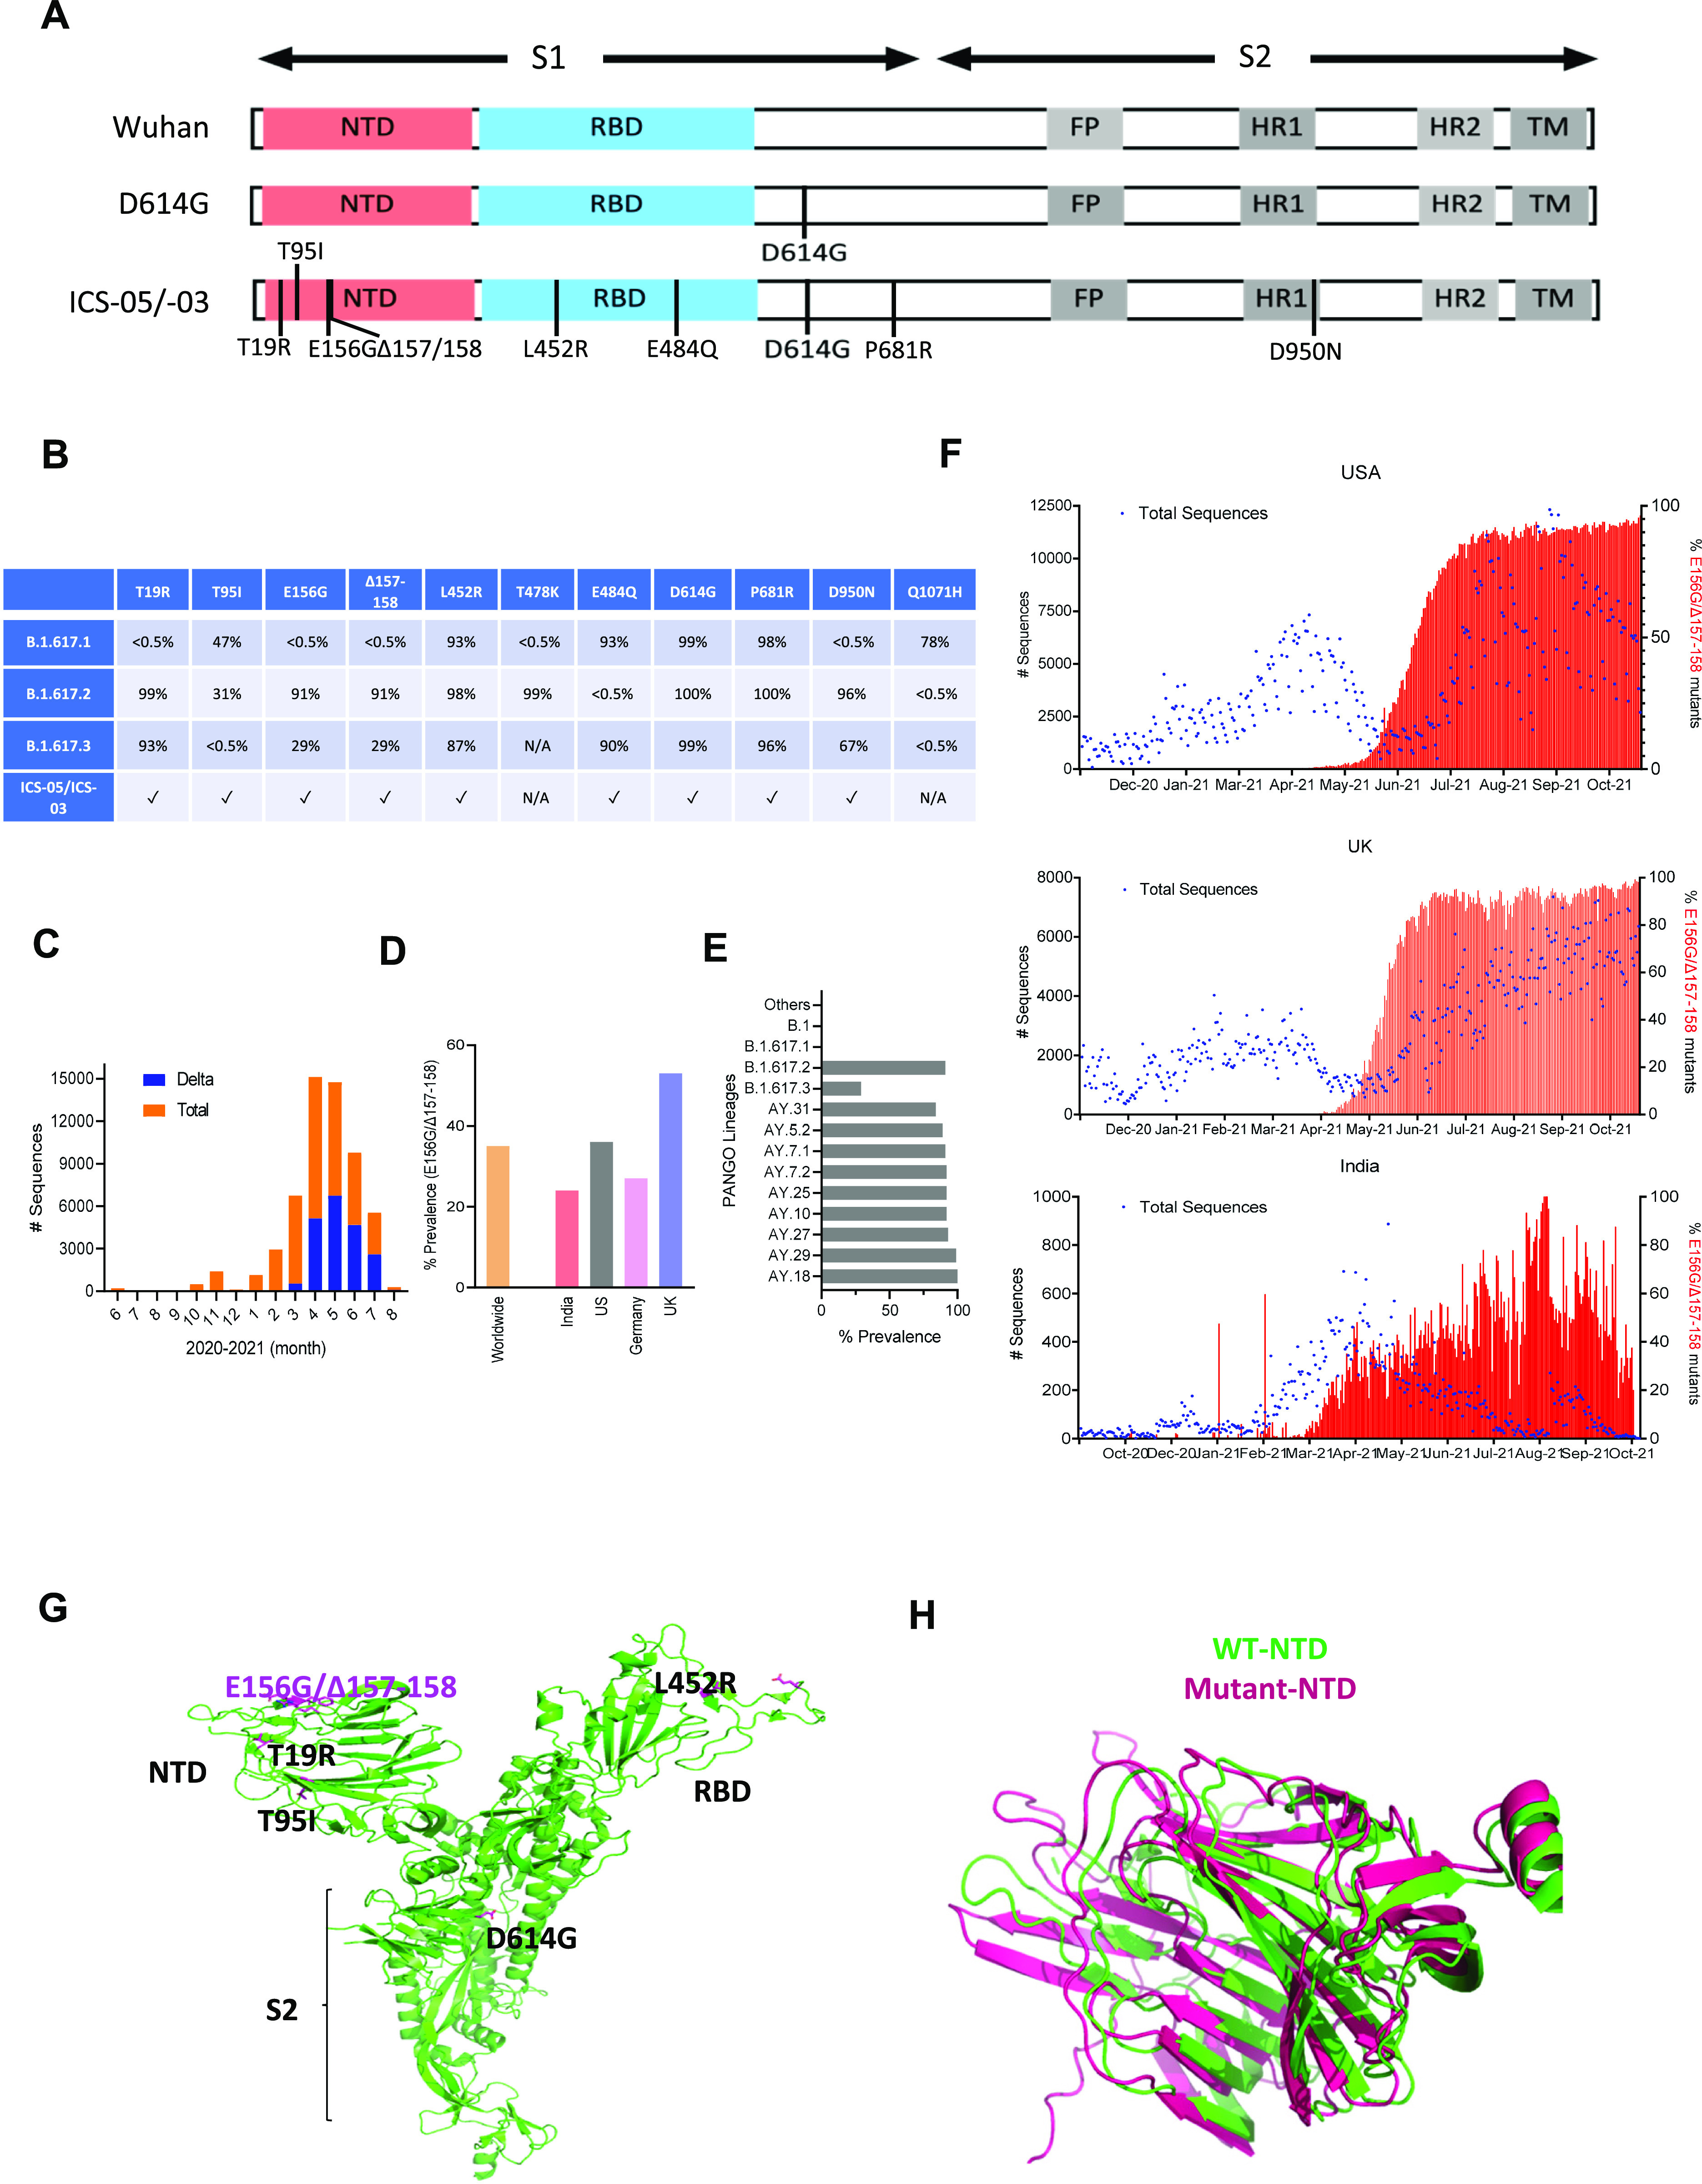
Figure 1. Sequence characterization, geographical prevalence, and structural implications of spike mutations.

(A) Schematics of the spike protein representing the mutations in the S1 and S2 domains. Different regions of spike proteins are indicated: NTD (N-terminal domain), receptor-binding domain, FP (fusion peptide) HR1 and 2 (heat repeat 1 and 2), and TM (transmembrane region). (B) The table represents the frequency of various mutations found in the SARS-CoV-2 sequences submitted on GISIAD till October 2021. (C) Bar graph indicates the frequency of the Delta variant during the second wave in India. The orange color shows the total number of SARS-CoV-2 sequences submitted each month (denoted on the X-axis), and the blue represents the number of sequences among total sequences submitted between the period of June 2020–August 2021. The data were obtained from the GISAID SARS-CoV-2 database (https://outbreak.info/). (D) The prevalence of E156G/∆157-158 mutation in the indicated countries and worldwide. (E) Occurrence of E156G/∆157-158 in the PANGO lineages (https://cov-lineages.org/index.html). (F) The numbers of sequences carrying E156G/∆157-158 were reported by indicated countries. The left Y-axis represents the total number (#) of SARS-CoV-2 genome sequences (blue dots), whereas the right Y-axis denotes the percentage of E156G/∆157-158 occurrence (red bars). The X-axis represents the months of sequence submission. (G) Mutations found in the spike ICS-05 are shown in the sticks (magenta) in the spike protomer (green, PDB ID: 7DF3). (H) Superimposition of WT NTD (green, PDB ID: 7DF3) and E156G/∆157-158 NTD (magenta) of the spike protein.
