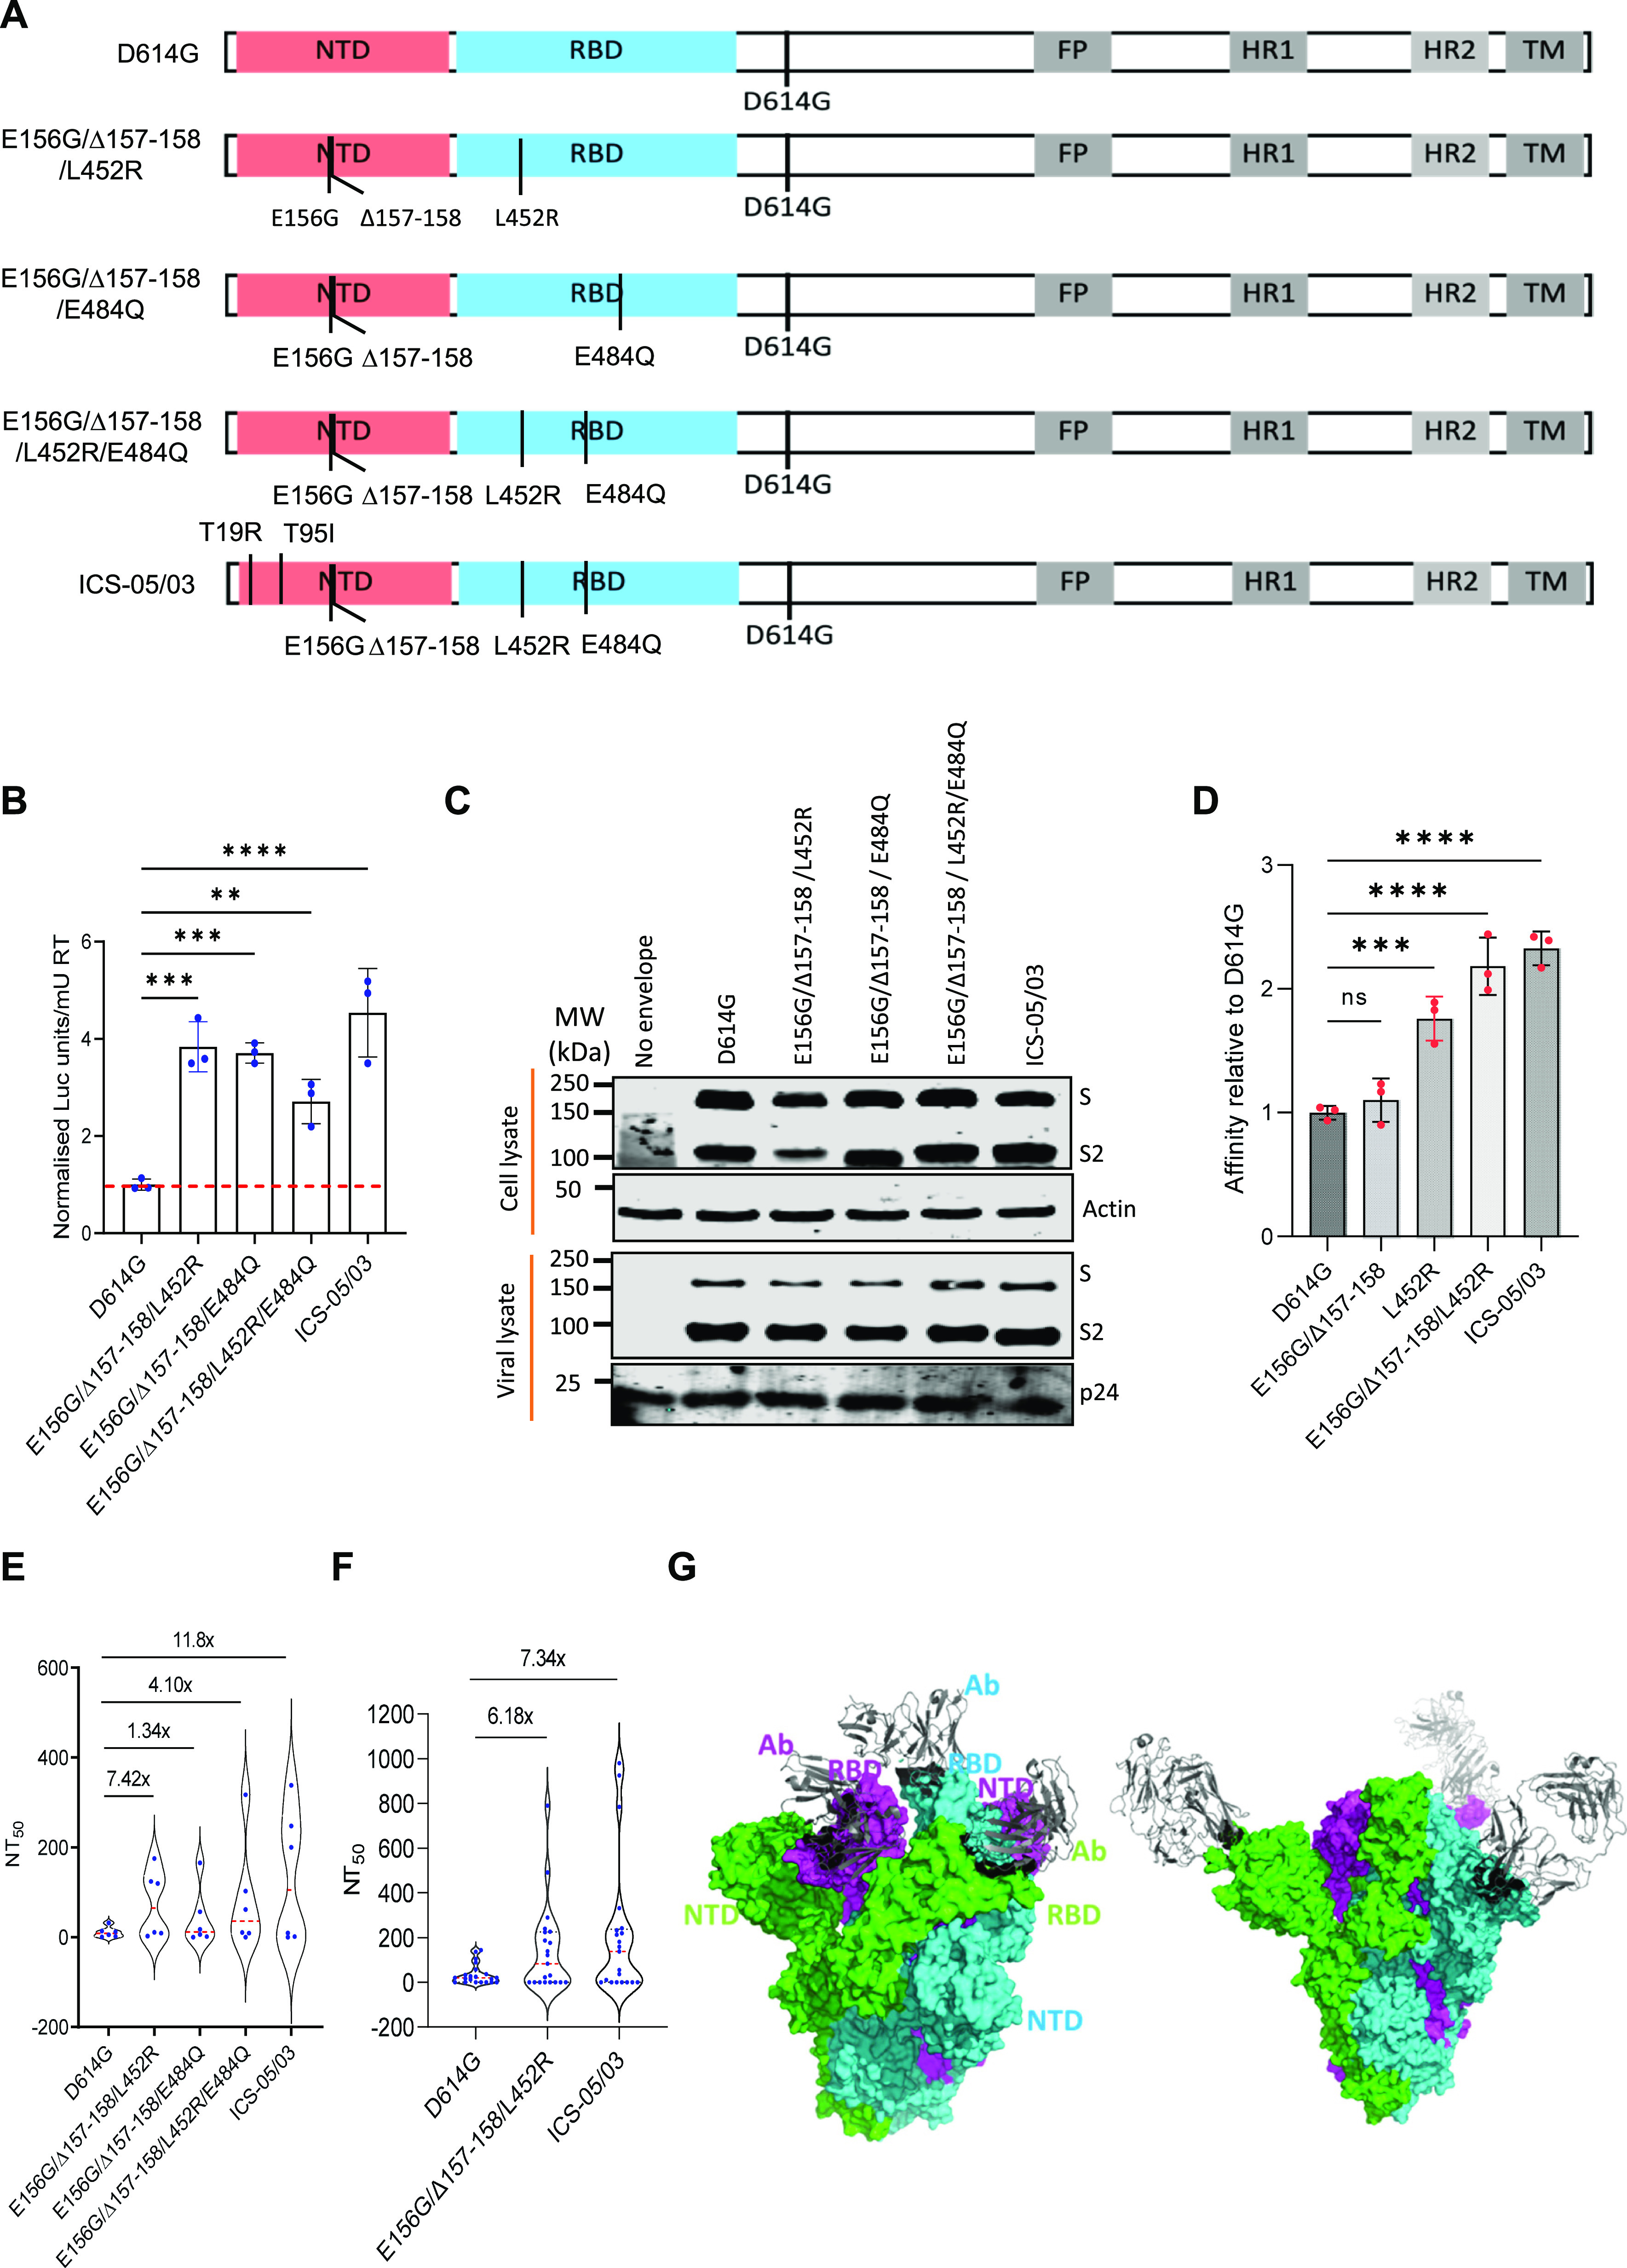
Figure 3. Infectivity and neutralization of spike pseudoparticles and structural analysis.
(A) Schematics of the spike mutants generated to check the combined effects of mutations. Amino acid positions are represented with respect to the Wuhan HU-1 sequence (NC_045512). (B) Infectivity profiles of the indicated spike mutant–pseudotyped lentiviruses (PV) in HEK293T ACE2 cells. The infectivity was normalized to the D614G-pseudotyped lentiviral particles. The data represent the mean of three replicates, and the significance was measured by the one-way ANOVA multiple comparison test to analyze the difference between the groups, n = 3. *P < 0·05, **P < 0·01, ***P < 0·001, ****P < 0·0001. (C) Western blots show the relative expression of the indicated spike proteins bearing mutations from the producer cell lysates and the viral lysates. β-actin and p24 served as loading controls for cell lysates and viral lysates, respectively. (D) Pull-down of the indicated spike pseudovirus using the protein G–bound ACE2-IgFc microbody. The affinity for the ACE2 receptor was normalized to the D614G-pseudotyped lentiviral particles. The data represent the mean of three replicates, and the significance was measured by the one-way ANOVA multiple comparison test to analyze the difference between the groups, n = 3. *P < 0·05, **P < 0·01, ***P < 0·001, ****P < 0·0001. (E) The susceptibility of each spike mutant PV to neutralization by antibodies in the plasma obtained from vaccinated, test-negative individuals is plotted. Each data point represents mean NT50 values (50% neutralization titre) obtained against the indicated virus. The NT50 values were determined in triplicate, and means were calculated. The dotted red line represents the median response of each spike-pseudotyped virus. The fold difference in response to the neutralizing plasma was measured compared to the reference D614G mutant spike PV (n = 6). The statistical significance was calculated by Wilcoxon signed-rank test, two-tailed, nonparametric. (F) The susceptibility of spike mutant PV to neutralization by the antibodies in the plasma obtained from vaccinated, test-negative individuals who obtained the first and second dose at an interval of 3 mo. The dotted red line represents the median response of each spike PV. The fold difference in response to the neutralizing plasma was measured compared to the reference D614G mutant spike PV (n = 14). The statistical analysis was done by Wilcoxon signed-rank test, two-tailed, nonparametric. (G) The complex structure of the receptor-binding domain–specific antibody bound with a trimer of spike proteins (PDB ID: 6XEY). The surface of spike protein protomers are shown in green, cyan, and magenta, and the antibody (grey) bound to the receptor-binding domain of the spike protein is shown as a cartoon (left panel). The complex structure of the N-terminal domain–specific antibody bound with a trimer of spike proteins (PDB ID: 7C2L). The surface of spike protein protomers is shown in green, cyan, and magenta, and the antibody (grey) bound to the N-terminal domain of the spike protein is shown as a cartoon (right panel).
Source data are available for this figure.

