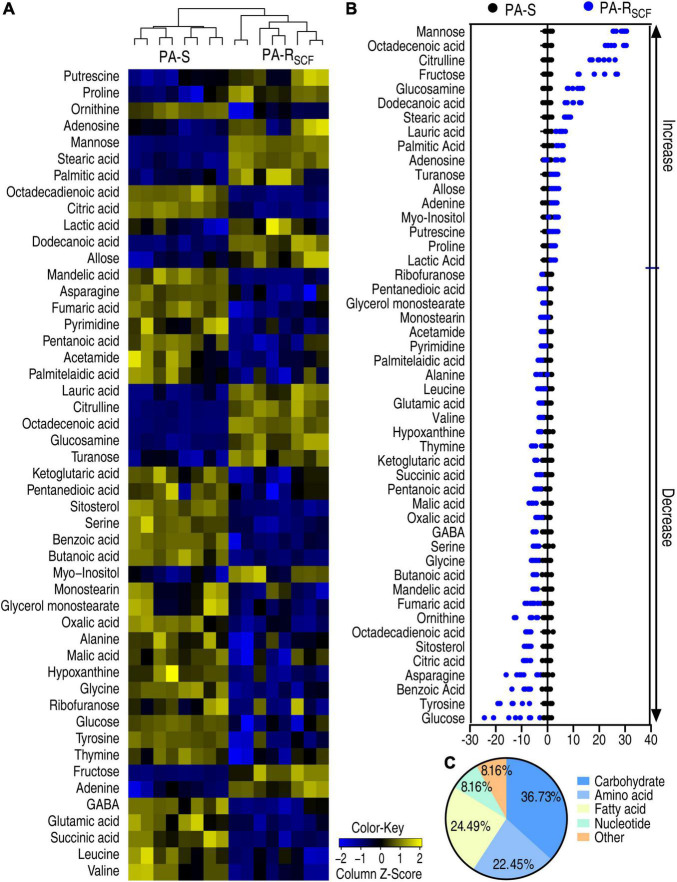
FIGURE 2.
Differentially metabolic profiles in PA-RSCF. (A) Heatmaps of differential abundance of metabolites in PA-S and PA-RSCF (row). Blue and yellow indicate lower and higher expression of the metabolites relative to the mean and standard deviation of the row metabolite level, respectively (see color scale). (B) Z-score plots of differential abundances of metabolites based on control. The data were separately scaled to the mean and standard deviation of the control (PA-S). Each point represents one metabolite in one technical repeat and colored by sample types. (C) Categories of differential abundance of metabolites in PA-S and PA-RSCF.

