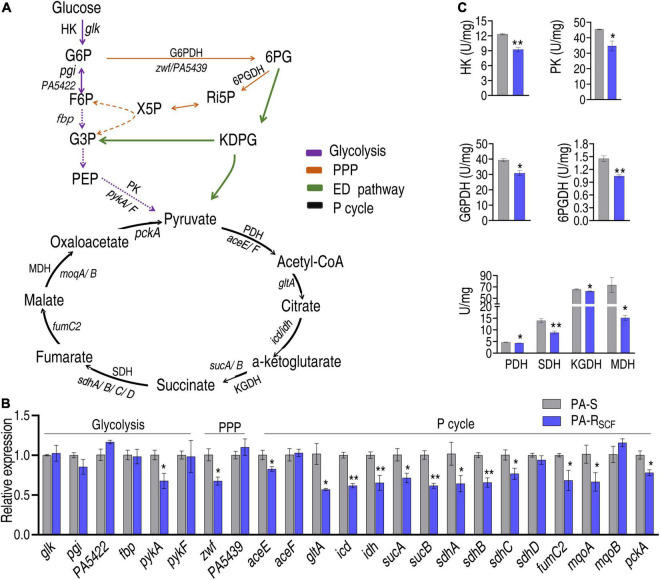
FIGURE 5.
Validation of the depressed central carbon metabolism. (A) Map showing that the composition of central carbon metabolism includes glycolysis, PPP, ED pathway, and P cycle. G6P, glucose-6-phosphate; F6P, fructose-6-phosphate; 6PG, 6-phosphogluconate; KDPG, 2-keto-3-deoxy-6-phosphogluconate; Ri5P, ribulose-5-phosphate; X5P, xylulose-5-phosphate; G3P, glyceraldehyde-3-phosphate; PEP, phosphoenolpyruvate; HK, hexokinase; PK, pyruvate kinase; PDH, pyruvate dehydrogenase; KGDH, alpha-ketoglutarate dehydrogenase; SDH, succinate dehydrogenase; MDH, malate dehydrogenase; G6PDH, glucose 6-phsophate dehydrogenase; 6PGDH, 6-phosphogluconate dehydrogenase. Solid lines represent single-step reaction and dashed lines represent multistep reaction. Arrows indicate the direction of the reaction. (B) qRT-PCR for expression of key genes in glycolysis, PPP, and P cycle. (C) Activity of enzymes in glycolysis, PPP, and P cycle. Results are displayed as mean ± SEM and three biological repeats are performed. Significant differences are identified. *p < 0.05 and **p < 0.01.

