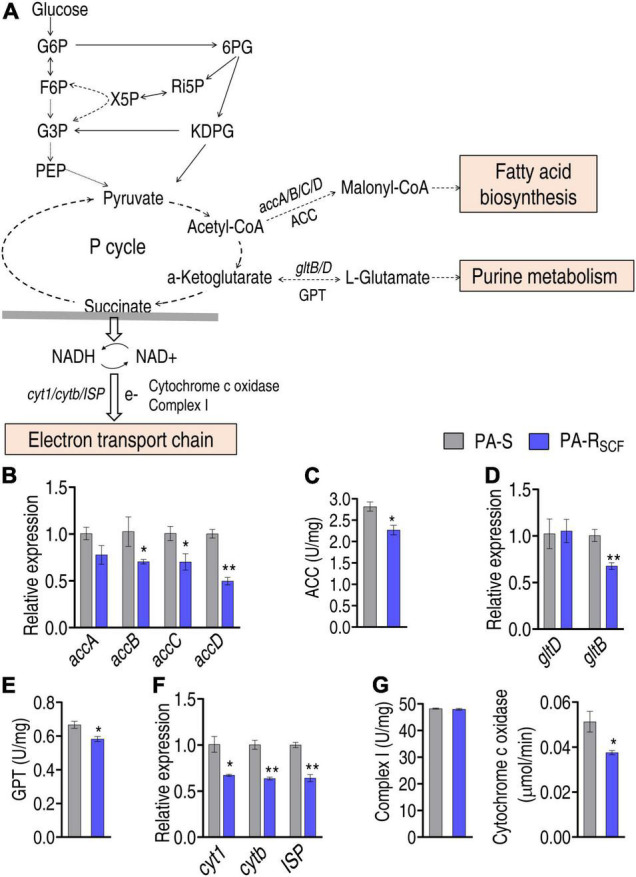
FIGURE 6.

Investigation of the central carbon metabolism-related metabolic pathways. (A) Map showing main central carbon metabolism-related metabolic pathways. The abbreviations are referred in Figure 5A legend. Solid lines represent single-step reaction and dashed lines represent multistep reaction. Arrows indicate the direction of the reaction. (B) Expression of key genes entering biosynthesis of fatty acids. (C) Activity of enzyme entering biosynthesis of fatty acids. ACC, acetyl-CoA carboxylase. (D) Expression of key genes entering glutamate metabolism. (E) Activity of enzyme entering glutamate metabolism. GPT, glutamic-pyruvic transaminase. (F) Expression of key genes entering electron transport chain. (G) Activity of enzyme entering electron transport chain. Results are displayed as mean ± SEM and three biological repeats are performed. Significant differences are identified. *p < 0.05 and **p < 0.01.
