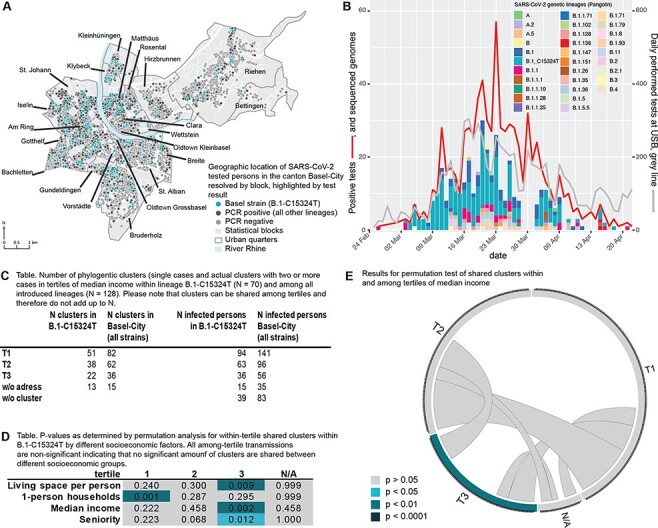
Figure 2.

SARS-CoV-2 transmission in and among socio-economic and demographic groups during the first COVID-19 wave in Basel-City. A) Spatial positive/negative case distribution throughout the city with the most dominant SARS-CoV-2 variant (B.1-C15324T), the focus of this study, highlighted in turquoise. B) Epidemiological curve for Basel-City and distribution of phylogenetic lineages (pangolin nomenclature) from 25 February to 22 April 2020. C) Summary for inferred phylogenetic clusters within (1) all lineages and (2) the major variant B.1-C15324T in tertiles of median income. High number of infected people within a tertile with a low number of clusters indicates presence of large transmission clusters whereas large number of clusters and low number of people infected within a tertile indicates random infections and cryptic transmission. D) Results of a significance test for transmission between tertiles of different socio-economic factors. T1: low, T2: intermediate, T3: high, N/A: no available data or censored for privacy reasons. E) Visualisation of a signi ficance,test for transmission within (indicated on circle edges) and among (intra-circle connections) tertiles of median income.
