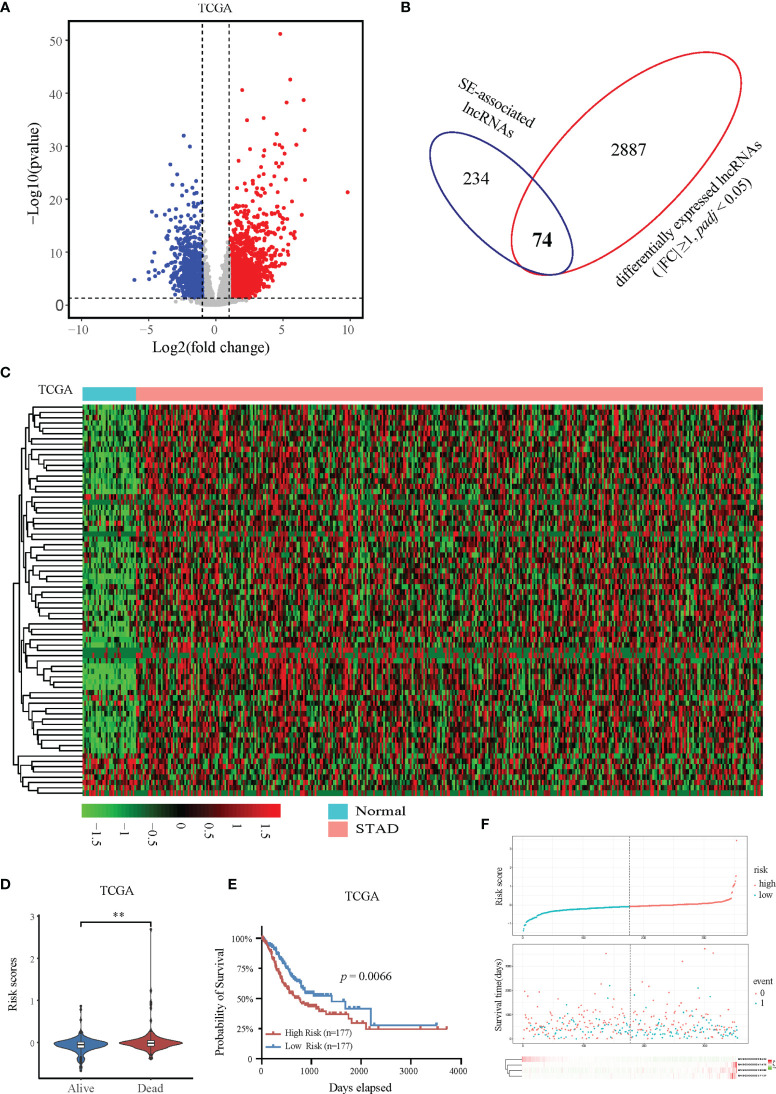
Figure 2.
Expression and prognostic analysis of super-enhancer-associated lncRNAs in patients with STAD. (A) Volcano plot showing the expression changes of SE-associated lncRNAs in STAD samples compared with normal stomach tissues. The red dots represent up-regulated lncRNAs (FC ≥ 1, Q value < 0.05), and the blue dots represent down-regulated lncRNAs in STAD patients (FC ≤ -1, Q value < 0.05). (B) Venn diagram representing the intersection of 2961 differentially expressed lncRNAs in patients with STAD and the 308 SE-associated lncRNAs identified above. (C) Expression profiling of 74 differentially expressed SE-associated lncRNAs in human STAD samples and normal stomach tissues. (D) The risk scores of alive or dead STAD patients predicted by expression of SE-associated lncRNAs from TCGA dataset. (E) The prognosis of SE-associated lncRNAs in STAD patients with high risk and low risk based on the RiskScore signature. (F) The distributions of the four lncRNAs in groups between high and low risk in STAD patients. The top was the risk score of STAD patients calculated according to the RiskScore signature and split into two groups on basis of medium score. The middle represented the survival status. The bottom heatmap showed the differential profile of four lncRNAs. The expression and clinical data of all lncRNAs were downloaded from TCGA database (https://www.cancer.gov/). **Indicates p < 0.01.

