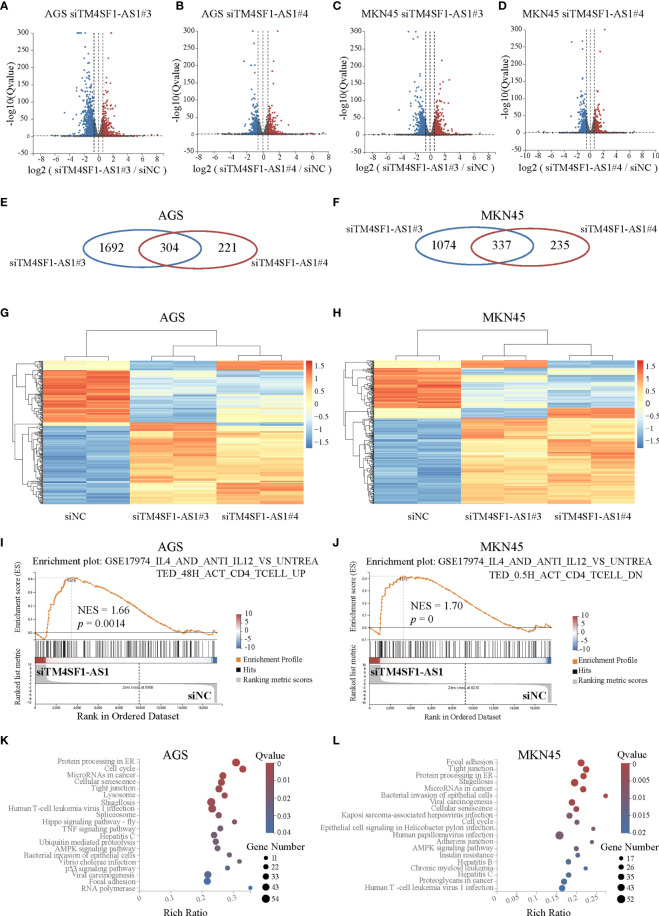
Figure 8.
Pathway analysis of TM4SF1-AS1 knockdown in two STAD cells. (A–D) Volcano map showing the up- and down-regulated genes after TM4SF1-AS1 knockdown in AGS and MKN45 cells with two siRNA targets (siTM4SF1-AS1#3 and siTM4SF1-AS1#4). The red dots indicate up-regulated genes, and blue dots signify down-regulated genes. (E, F) Venn diagram displaying the differentially expressed genes by the intersection of siTM4SF1-AS1#3 and siTM4SF1-AS1#3 in (E) AGS and (F) MKN45 cells. (G, H) Heatmap showing the up- and down-regulated genes after TM4SF1-AS1 knockdown in (G) AGS and (H) MKN45 cells with siTM4SF1-AS1#3 and siTM4SF1-AS1#4. The red dots indicate up-regulated genes, and blue dots signify down-regulated genes. (I, J) GSEA analysis was performed on (I) AGS and (J) MKN45 cells following TM4SF1-AS1 knockdown. (K, L) KEGG analysis was performed on the changed genes in (K) AGS and (L) MKN45 cells after TM4SF1-AS1 knockdown with siRNAs. RNA-seq data of TM4SF1-AS1 knockdown in AGS MKN45 cells was from this paper.

