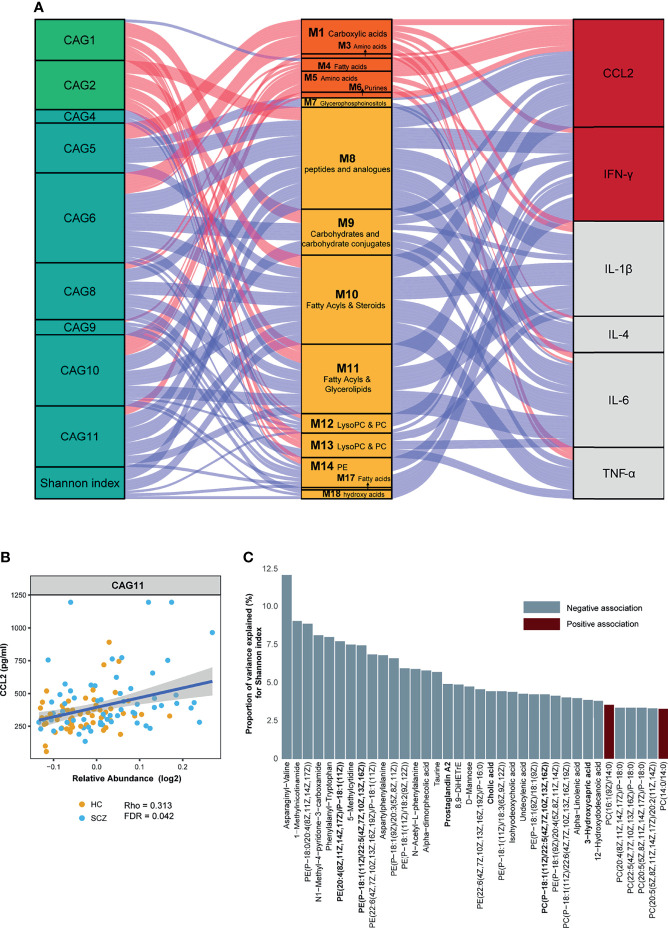
Figure 3.
Interrelationship between gut microbiota composition, host metabolic profile, and inflammatory cytokines. (A) Visualization of the correlation network according to Spearman correlation analysis between the gut microbiota of significant co-abundance groups (CAGs) and the inflammatory cytokines was mediated by serum metabolites. Red connections indicated positive correlations (Spearman correlation test, FDR < 0.05), whereas blue connections showed correlations that were negative (Spearman correlation test, FDR < 0.05). All correlations were adjusted for age, sex, body mass index, and diet. In the gut microbiota column, the green stratum represented CAGs that were highly enriched in the healthy control (HC) group, and the stratum colored in blue was increased in the schizophrenia (SCZ) group. In the metabolomics column, the orange stratum represented HC-enriched metabotypes, and the claybank stratum represented SCZ-enriched metabotypes. In the cytokines column, the red stratum represented elevated inflammatory cytokines in the SCZ group, and the gray represented no difference between the two groups. (B) Scatter plot representing the association between C–C motif chemokine ligand 2 and CAG11 in all subjects. (C) The percentage of variance in Shannon index that was explained by each serum metabolite that was significantly associated with Shannon index (P-value < 0.05). For each metabolite, red bars correspond to a positive β-coefficient, whereas blue bars correspond to a negative β-coefficient. Significance was assessed using ordinary least squares regression.

