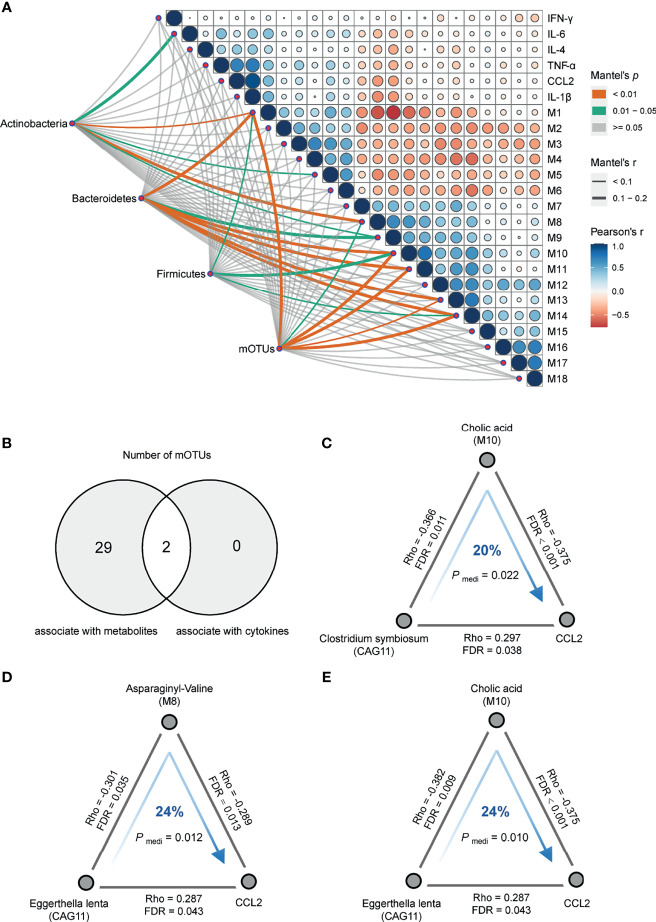
Figure 4.
Correlation analysis of multi-omics. (A) Pairwise comparisons of metabotypes and cytokines were shown, with a color gradient denoting Pearson’s correlation coefficients. Actinobacteria, Bacteroidetes, Firmicutes, and mOTUs were related to each metabotypes and cytokines by partial (age, sex, BMI and diet-corrected) Mantel tests. Edge width corresponded to the Mantel’s r statistic for the corresponding metabotypes and cytokines correlations, and edge color denoted the statistical significance based on 9,999 permutations. (B) Venn plot of the number of differentially abundant mOTUs that were associated with serum metabolites and cytokines, respectively. (C) Clostridium symbiosum contributed to C–C motif chemokine ligand 2 (CCL2) through cholic acid (Pmediation = 0.022, 20%). (D) Eggerthella lenta contributed to CCL2 through asparaginyl-valine (Pmediation = 0.012, 24%). (E) Eggerthella lenta contributed to CCL2 through cholic acid (Pmediation = 0.010, 24%). The gray lines indicated the Spearman correlations adjusting for age, sex, BMI and diet, with corresponding rho coefficients and false discovery rate values. The blue arrowed lines indicated the microbial effects on CCL2 mediated by metabolites, with the corresponding mediation P-values.

