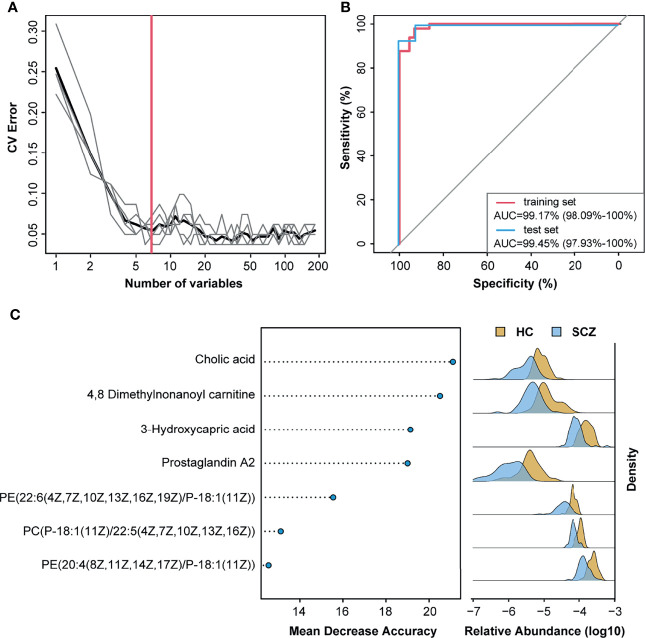
Figure 5.
Metabolites classify schizophrenia from healthy control. (A) Distribution of five trials of 10-fold cross-validation error in random forest classification of schizophrenia as the number of features increases. The model was constructed using relative abundance of the 50 metagenomic operational taxonomic units and 133 metabolites from 70% of schizophrenia and healthy control samples (training set). The black curve indicates the average of the five trials (gray lines). The pink line marks the number of features in the optimal set. (B) Receiver operating characteristic analysis was performed to evaluate the diagnostic performance of these seven metabolite biomarkers, and the areas under the curve of the training set and test set were 99.17% and 99.45%, respectively. (C) The seven metabolites with most weight to discriminate schizophrenia and controls were selected by the cross-validated random forest models. The length of line indicated the importance of the metabolites for classification.

