
Figure 11.
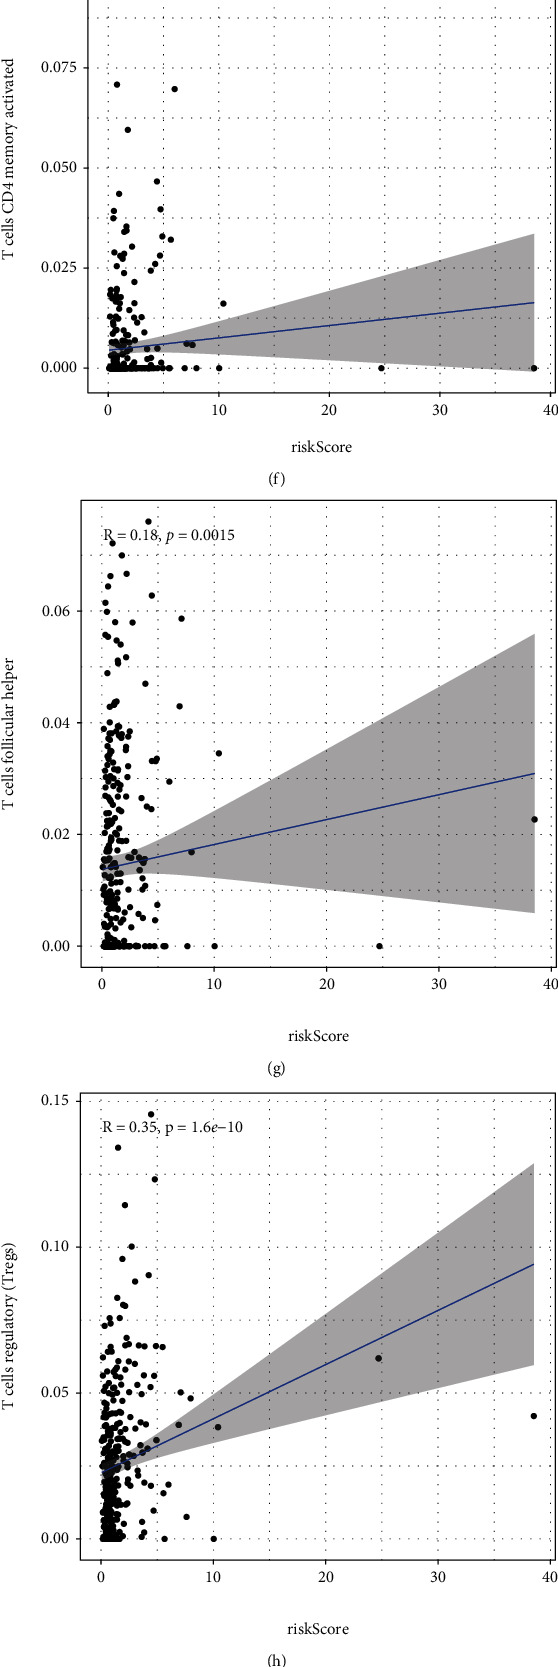
Associations of risk score with tumor immune microenvironment in ccRCC. (a) Differences in immune score between low- and high-risk subgroups. (b) Differences in stromal score between high- and low-risk subgroups. (c) The expressing pattern of immune cells based on risk score. (d–i) Correlation analysis confirmed that risk score was positively associated with immune infiltration levels of immune cells. (j–l) Correlation assays demonstrated that risk score was negatively associated with immune infiltration levels of immune infiltrates of M1 macrophages, resting mast cells, and neutrophils.