
Figure 12.
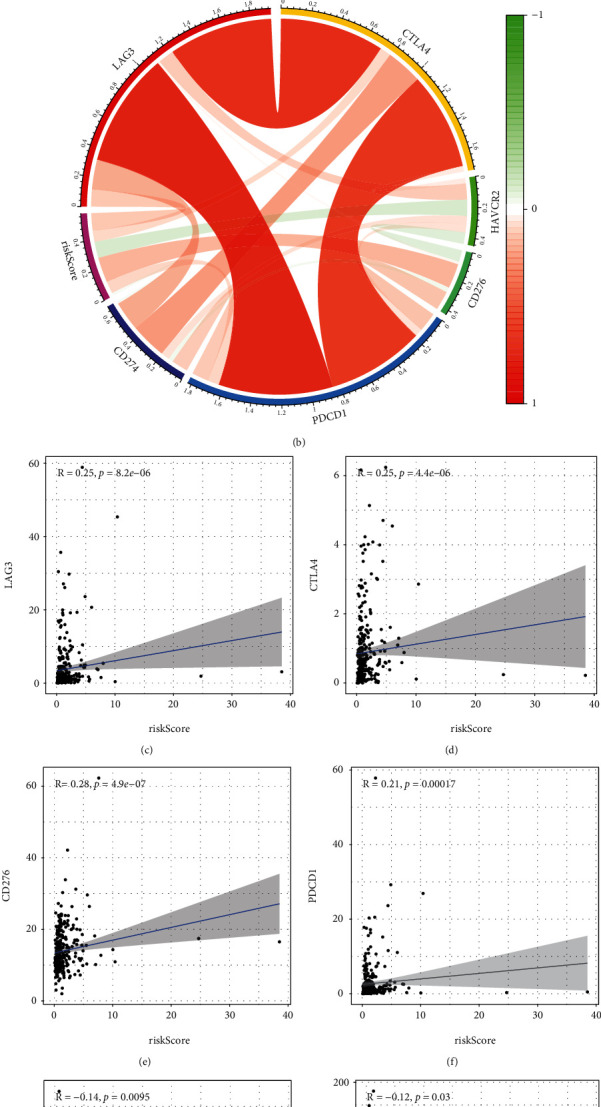
The comparison of immune checkpoint expressions between low and high subgroups. (a) Cases with high-risk score expressed increased levels of LAG-3, CTLA4, CD276, and PDCD1, whereas HAVCR2 and CD274 were highly expressed in patients with low-risk score. (b) The circus map of the correlation between risk score and LAG-3, CTLA4, HAVCR2, PDCD1, CD276, and CD274. (c–f) LAG-3, CTLA4, CD276, and PDCD1 were positively related to the risk scores, whereas (g, h) CD274 and HAVCR2 were negatively related to the risk scores.