Figure 2.

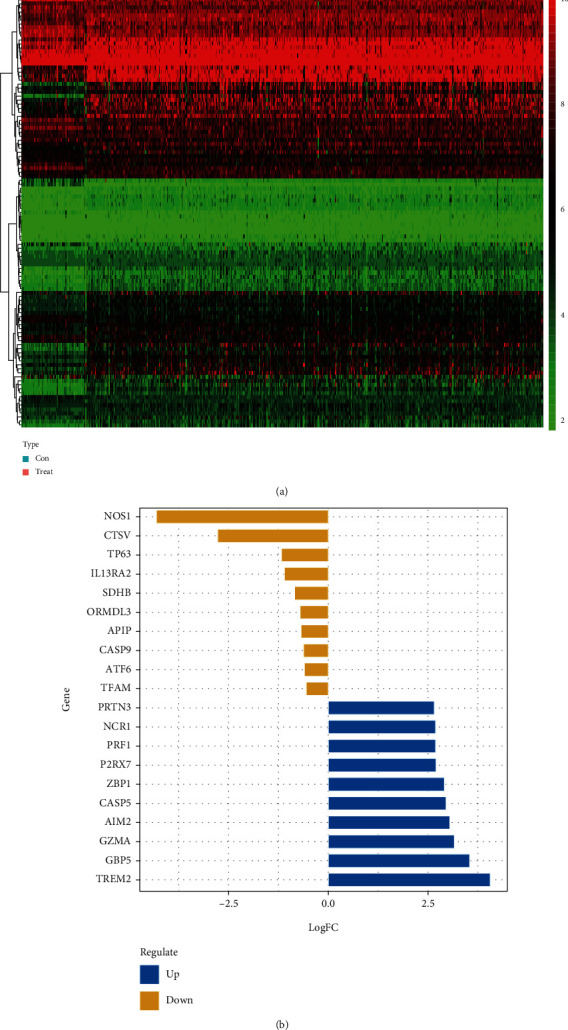
Identification of DE-PRGs between normal specimens and ccRCC specimens. (a) The heat map of DE-PRGs. (b) The top ten upregulated and downregulated PRGs.

Identification of DE-PRGs between normal specimens and ccRCC specimens. (a) The heat map of DE-PRGs. (b) The top ten upregulated and downregulated PRGs.