
Figure 7.
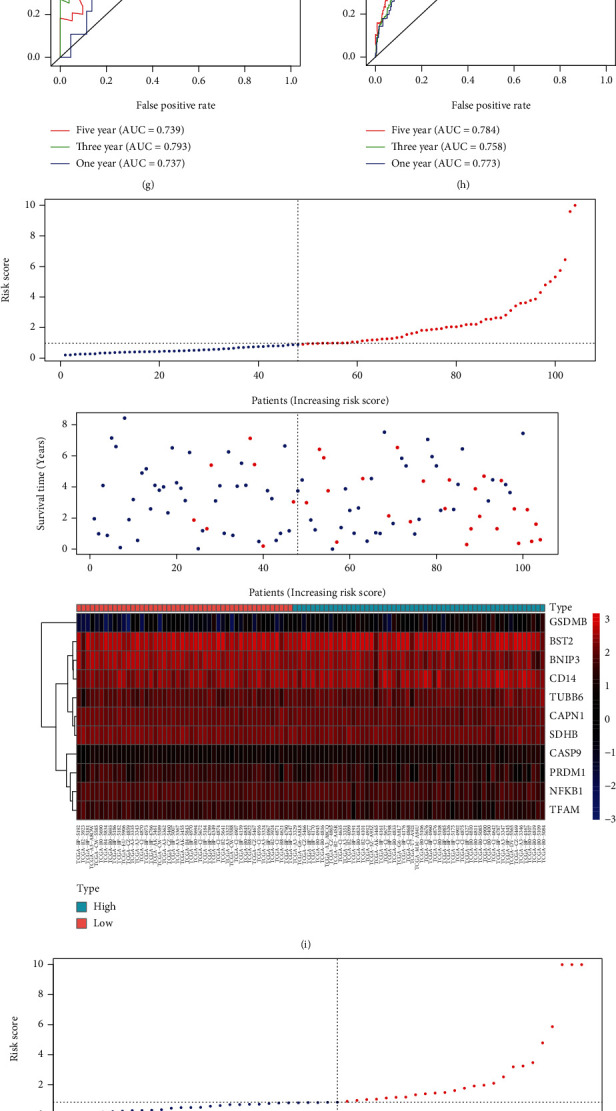
Testing the predictive signature based on 11 pyroptosis-associated genes in different cohorts to determine its reliability. (a–d) The Kaplan-Meier survival curves of the 11-PRG prognostic signature in several groups. (e–h) Time-dependent ROC curves. (i–l) Risk score distribution, survival status, and heat map.