
Figure 2.
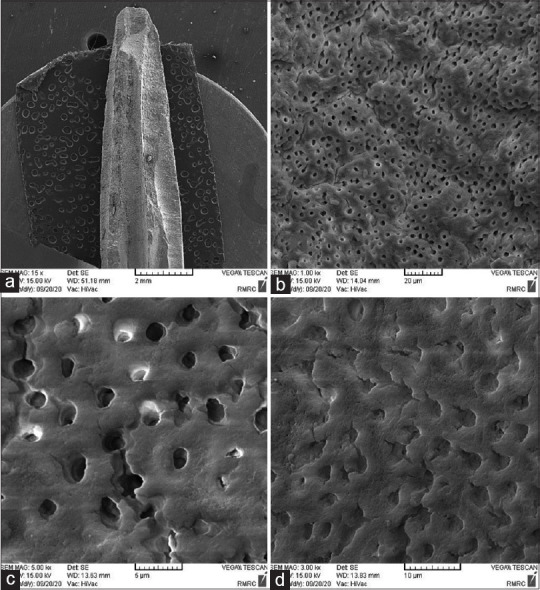
Scanning electron microscopy picture for the conformation of lack of biofilm formation in control group (a) with ×14 magnitude, (b) with ×1000 magnitude, (c) with ×3000 magnitude, (d) with ×5000 magnitude.
Official websites use .gov
A
.gov website belongs to an official
government organization in the United States.
Secure .gov websites use HTTPS
A lock (
) or https:// means you've safely
connected to the .gov website. Share sensitive
information only on official, secure websites.
Scanning electron microscopy picture for the conformation of lack of biofilm formation in control group (a) with ×14 magnitude, (b) with ×1000 magnitude, (c) with ×3000 magnitude, (d) with ×5000 magnitude.