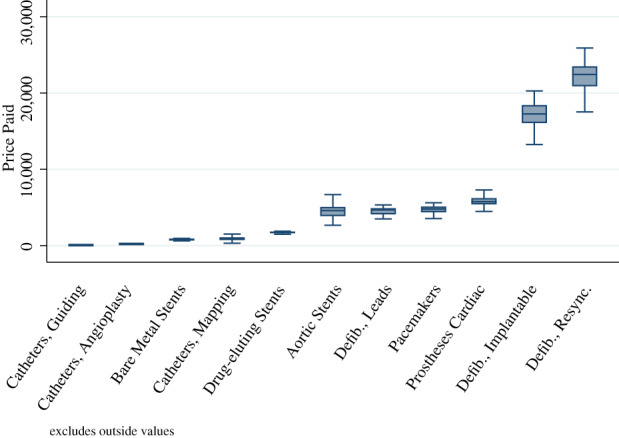
FIGURE 1.

Variation in prices of important medical device categories. Box–Whisker plot of the distribution of average price per unit across hospitals within each top cardiac device category in 2010, for the sample of hospitals in column 4 of Table 1. Top cardiac device categories are ordered from left to right in the ascending order of mean price per unit: catheters vascular guiding, catheters vascular angioplasty balloon, stents vascular coronary balloon‐expandable, catheters cardiac mapping/ablation, stents vascular coronary balloon‐expandable drug‐eluting, stent/grafts vascular aortic, leads implantable defibrillator/pacemaker, pacemakers cardiac implantable, prostheses cardiac valve biological, defibrillator/cardioverter/pacemakers implantable, and defibrillator/cardioverter/pacemakers implantable resynchronization. Authors' calculations using de‐identified Supply Guide data [Color figure can be viewed at wileyonlinelibrary.com]
