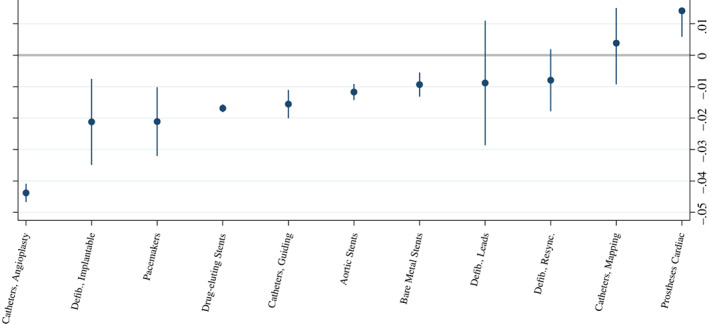
FIGURE 2.

Associations between management score and medical device prices, by category. Author's calculations using merged, de‐identified American Hospital Association (AHA), Management Survey, and Supply Guide data. Point estimates and 95% confidence interval (based on robust standard errors clustered at the hospital‐product level) for the relationship between average unit price and aggregate hospital management practice score, as well as other characteristics, within each top cardiac device category. Top cardiac device categories are ordered from left to right in the ascending order of point estimates: catheters vascular angioplasty balloon, defibrillator/cardioverter/pacemakers implantable, pacemakers cardiac implantable, stents vascular coronary balloon‐expandable drug‐eluting, catheters vascular guiding, stent/grafts vascular aortic, stents vascular coronary balloon‐expandable, leads implantable defibrillator/pacemaker, defibrillator/cardioverter/pacemakers implantable resynchronization, catheters cardiac mapping/ablation, and prostheses cardiac valve biological. Each regression sample is at the hospital‐month‐catalog number level. Specification controls for category‐catalog number‐year fixed effects, Census division fixed effects, and hospital characteristics of interest from columns 3 and 4 of Table 2. Sample includes all hospital‐years 2010–2015 [Color figure can be viewed at wileyonlinelibrary.com]
