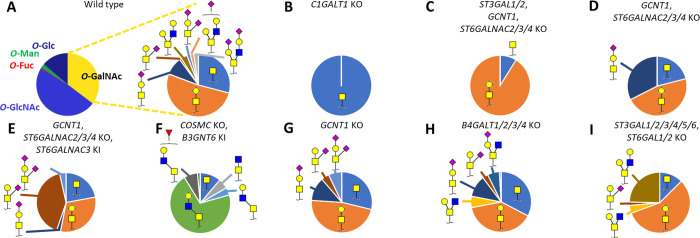
Figure 4.
O-Glycan profiles of glycoengineered HEK293 total cell lysates. (A) Pie diagrams indicate the average relative intensity of O-glycan types and individual O-GalNAc glycoforms for HEK293WT (n = 3). For the glycoengineered cells (B–I), only O-GalNAc glycans are displayed. The most abundant glycan structures are annotated per sample. Detailed information on all glycan abundances and structures can be found in Supporting Table S5 and Figure S8.

