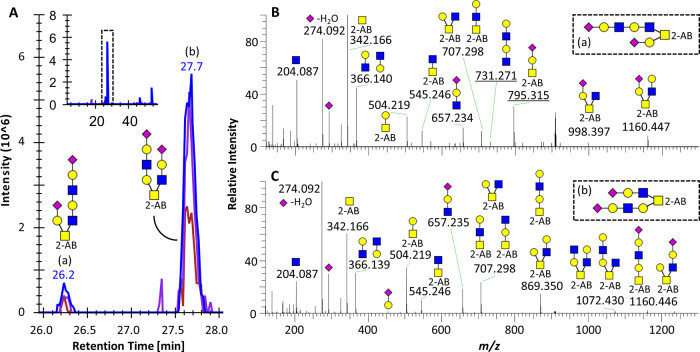
Figure 5.
Structural characterization of two elongated O-GalNAc core2 isomers. (A) EICs for glycan composition H3N3S2 (m/z 908.841, 2+) in the HaCaTWT sample, indicating the presence of two isomers (a and b). The inset shows the full elution range, highlighting the retention time area of the two isomers. (B) MS/MS spectrum of the first eluting species. (C) MS/MS spectrum of the second eluting species. All annotated peaks are 1+, glycan cartoons represent B and Y ions, and underlined m/z values in panel (B) indicate the diagnostic ions that allow the differentiation between the two structures.

