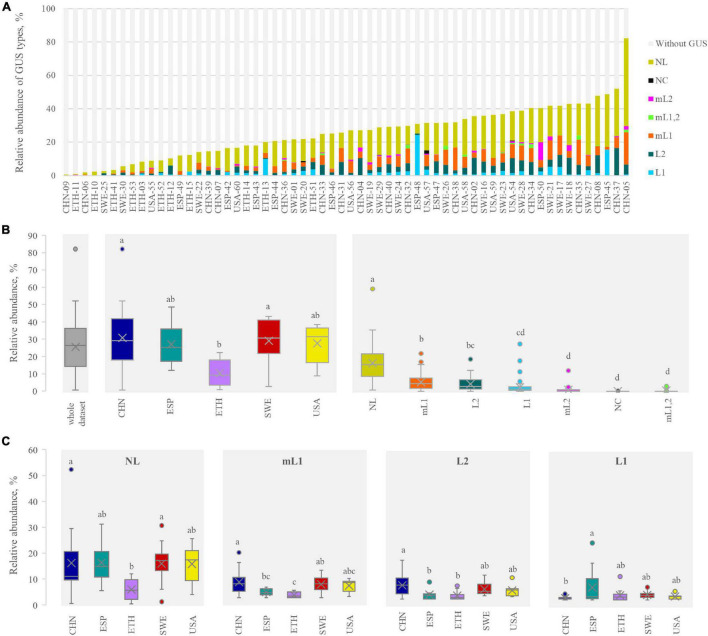
FIGURE 4.
β-glucuronidases (GUS) abundance profile in each metagenome (A) and in the whole dataset, in each cohort, and for each structural category (B). The abundance of the four main categories in each cohort is shown in (C). In (B,C) cohorts or categories sharing the same letter did not significantly differ (P ≥ 0.05, ANOVA, Tukey). In determining the GUS abundance profile, for the bins bearing more than one GUS, the abundance was multiplied by the number of GUS therein identified.

