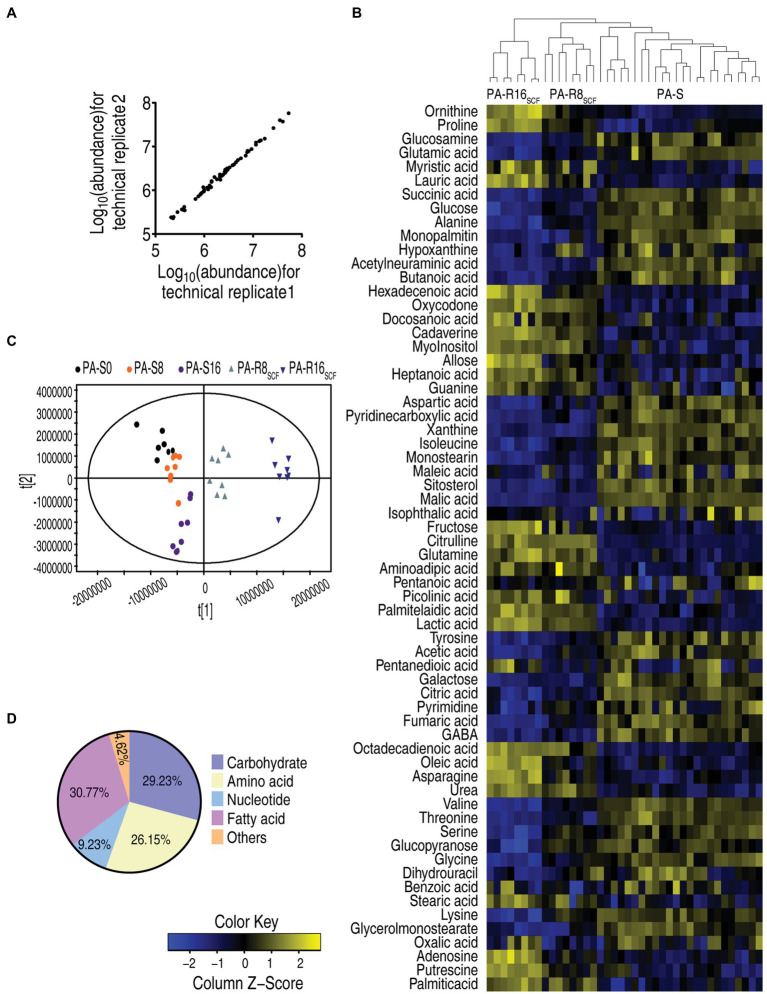
Figure 2.
Metabolic profiles between three PA-S and two PA-R strains. (A) Reproducibility of the metabolomic profiling platform used in the discovery phase. Abundance of metabolites quantified in samples over two technical replicates is shown. The Pearson correlation coefficient between technical replicates varies between 0.998 and 0.999. (B) Heat map of unsupervised hierarchical clustering of different metabolites (row). Blue and yellow indicate decrease and increase of the metabolites scaled to mean and SD of row metabolite level, respectively (see color scale). (C) Principal component analysis (PCA) of the three PA-S and two PA-R strains. Each dot represents the technical replicate of samples in the plot. (D) Categories of the metabolites. Sixty-four metabolites are searched against in KEGG for their categories, and the pie chart is generated in Excel 2010 (Microsoft, United States).

