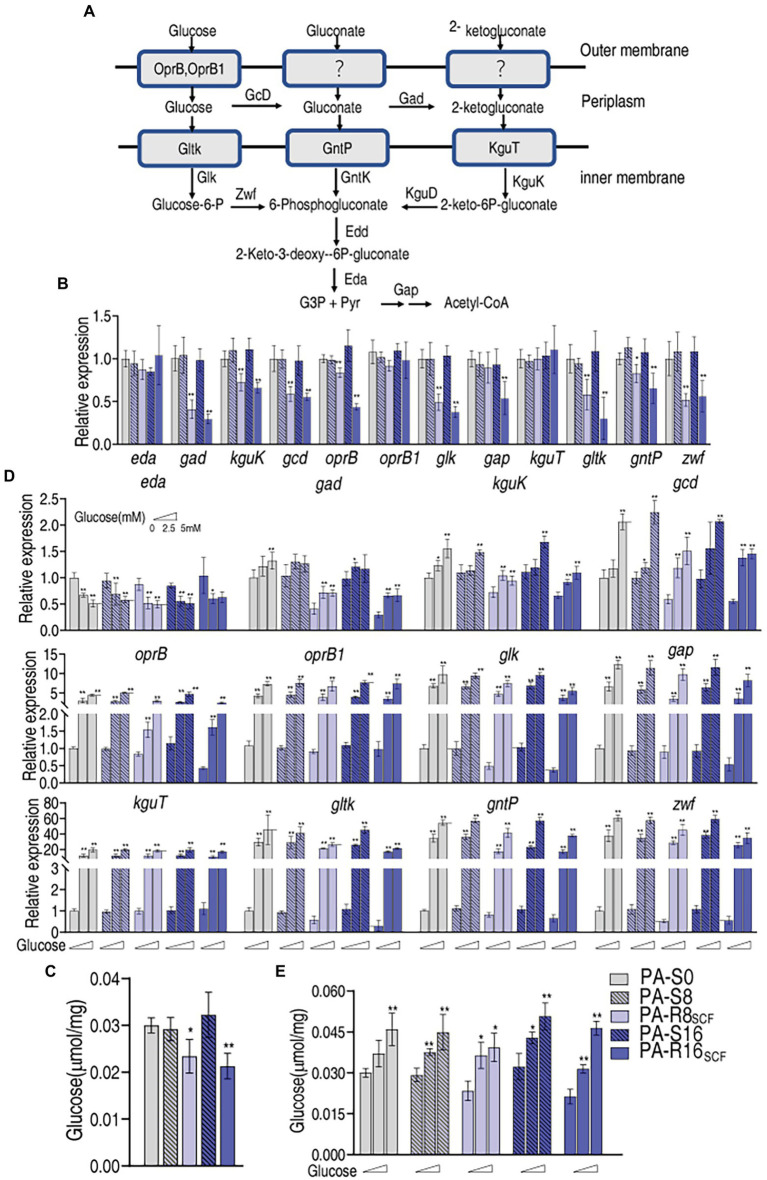
Figure 5.
Glucose transport with and without exogenous glucose in PA-R8SCF and PA-R16SCF. (A) Metabolic diagram of glucose transport (Daddaoua et al., 2017). (B) Quantitative real-time PCR (qRT-PCR) for expression of genes encoding glucose transport proteins between PA-R8SCF, PA-R16SCF, and PA-S8, PA-S16, respectively. (C) Glucose level in data (B). (D) qRT-PCR for expression of genes encoding glucose transport proteins between PA-R8SCF, PA-R16SCF, and PA-S8, PA-S16, respectively, in the presence of different concentrations of glucose. (E) Glucose level in data (D). Results are displayed as mean ± SEM and at least three biological repeats are performed. Significant differences are identified *p < 0.05, **p < 0.01.

