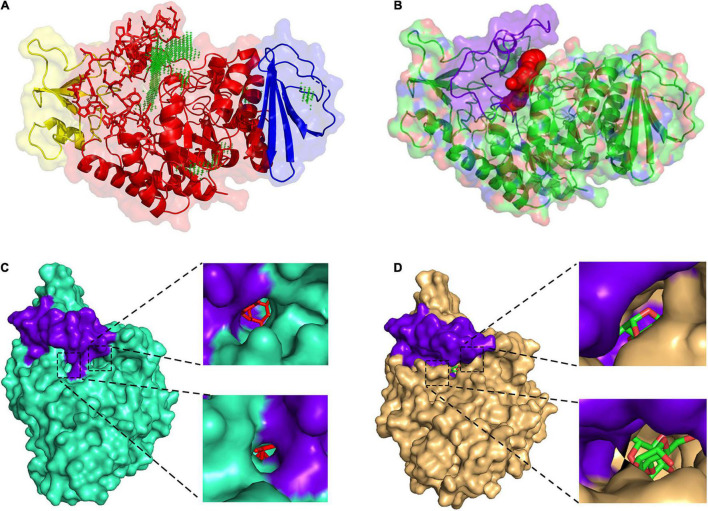
FIGURE 6.
Comparison of the catalytic pocket of QsGH13 and HaG. (A) QsGH13 catalytic pocket prediction result; green represents catalytic pocket. (B) The shape and size of the QsGH13 catalytic pocket. (C) The schematic diagram of the catalytic pocket of HaG. (D) The schematic diagram of the catalytic pocket of QsGH13. Purple represents the β → α loop 4 region; on the left is the overall schematic diagram of the protein catalytic pocket, the upper right is the right view of the catalytic pocket, and the lower right is the left view of the catalytic pocket.

