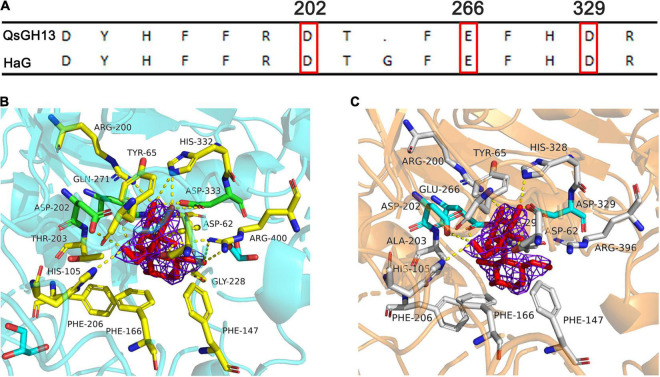
FIGURE 7.
Comparison of QsGH13 and HaG of amino acid residues near the active site. (A) Alignment of amino acid residues near the substrate recognition site. The red box indicates the catalytic site. (B) Fifteen amino acid residues around the catalytic sites of HaG. (C) Fourteen amino acid residues around the catalytic sites of QsGH13. Dashed lines indicate hydrogen bonding with the enzyme and substrate. The purple network represents the electron density cloud.

