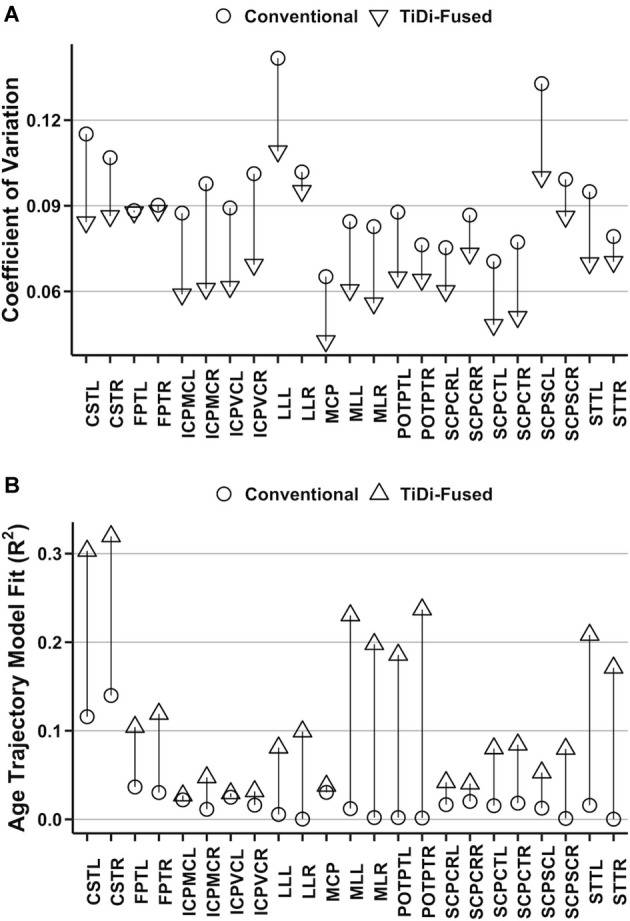
Figure 4.

Quantitative analysis of original and optimized pipelines using brainstem white matter regions of interest. (A) Comparison of coefficient of variation in the original and optimized pipelines. (B) Proportion of age trajectory variance (R2) explained by apparent fiber density (AFD) in each white matter tract.
