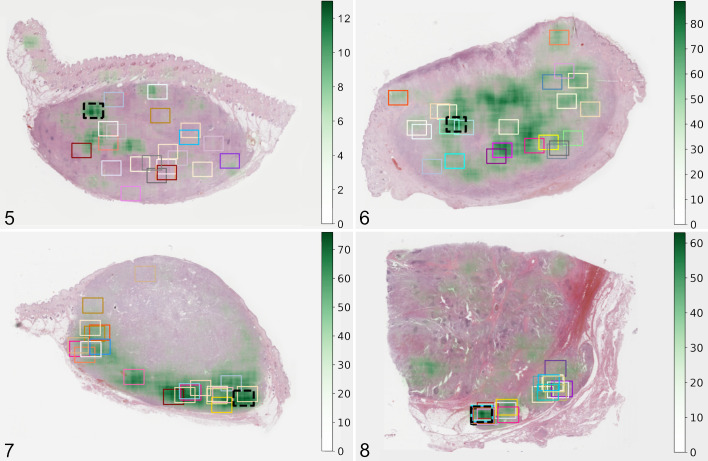
Figures 5–8.
Approximate location of the mitotic count region of interest (MC-ROI) selected manually by each study participant (represented by the rectangular boxes) in the whole-slide images. The black box with the dashed line represents the algorithmically preselected MC-ROIs (algorithmic hotspot). The estimated MC heatmap is visualized by variable opacity of a green overlay (scale on the right side of image) on the histological image (hematoxylin and eosin stain) and is based on algorithmic mitotic figure predictions. Dark green areas represent mitotic hotspots. Figure 5. Case no. 33 with widely distributed MC-ROIs. Figure 6. Case no. 46 with widely distributed MC-ROIs. Figure 7. Case no. 38 with MC-ROIs mostly along the tumor periphery. Figure 8. Case no. 5 with similar MC-ROIs at a site of local tumor invasion.

