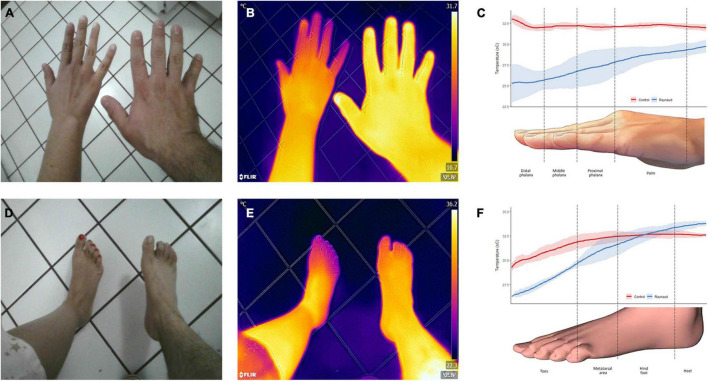
FIGURE 4.
Thermographic assessment of a patient with Raynaud’s phenomenon. Clinical photographs (A,D) and infrared thermal images (B,E) of the hand and feet of a patient with Raynaud’s phenomenon (left) and a healthy subject (right) were obtained. Color gradients of the heat maps are shown in the far-right side of (B,E). Purple/blue indicates a lower temperature, while yellow/white indicates higher temperatures. Analysis of the temperature distribution across the different structures are presented in (C,F). The patient’s temperature was significantly lower to the control and exhibited a higher degree of variation, as demonstrated by wider confidence intervals. The solid line represents the mean temperature, and the shaded area, its 95% CI. Images, courtesy of JR-G, were acquired using the Skin and Wound mobile app (Swift Medical Inc., Toronto, ON, Canada) paired to a FLIR One Pro camera. Analysis of the images was performed in Swift’s dashboard.

