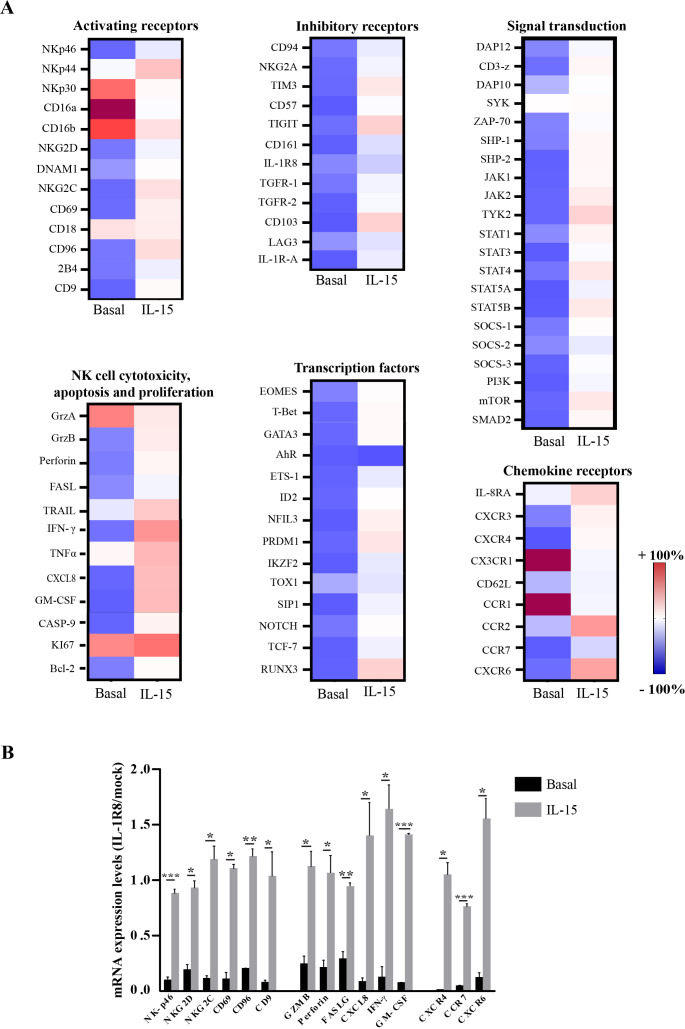
Figure 2.
Interleukin-1 receptor 8 (IL-1R8) silencing under basal conditions and on IL-15 activation impacts on NK cell gene expression profile. (A) Gene-expression heatmaps represented as a ratio between IL-1R8-transfected and mock-transfected resting (left column, basal,) or IL-15 activated (right column, 2 hours) NK cells. Gene expression profiles were analyzed using 384-wells TaqMan array microfluidic cards. mRNA intensities are displayed as colors ranging from red to blue as shown in the key. Genes were divided into categories according to their function. The heatmap for basal and IL-15 treatment conditions is relative to independent experiments performed on three healthy donors. (B) Expression of the most upregulated genes, involved in different NK cell functions. mRNA levels have been reported as a ratio between IL-1R8 siRNA-transfected and mock-transfected NK cells in basal conditions (black columns) or upon IL-15 activation (gray columns).

