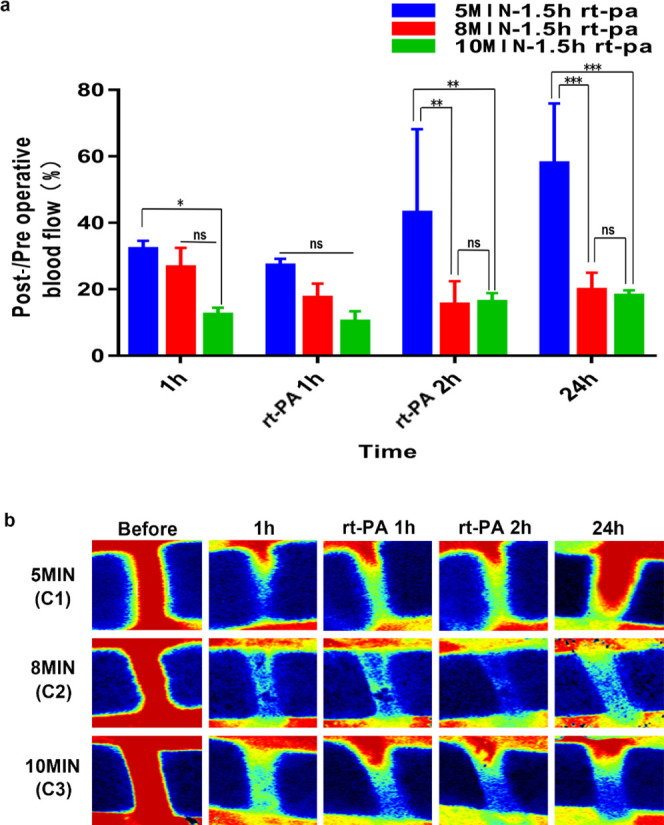
Figure 5.

(a) Post-/preoperative blood flow ratios in the C1–C3 groups. (b) shows serial Doppler blood flow images after exposure to 50% ferric chloride for 5, 8, and 10 min with rt-PA intravenously administered 1.5 h after operation. (****P < 0.0001, ***P < 0.001, **P < 0.01, and *P < 0.05; ns = not significant, n = 3). One-way ANOVA and two-way ANOVA.
