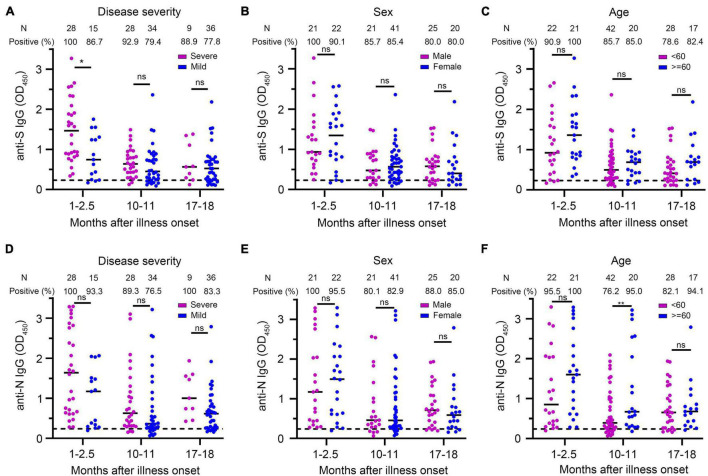
FIGURE 5.
Comparison of anti-S IgG and anti-N IgG levels in different groups of patients. (A–C) Anti-S IgG levels of COVID-19 patients at different times after illness onset according to the severity of the disease (A), sex (B), and age (C). (D–F) Anti-N IgG levels of COVID-19 patients at different times after illness onset according to the severity of the disease (D), sex (E), and age (F). Bars represent the medium. Dotted lines represent the threshold for positive in these assays. Multivariate generalized linear models were used to compare the difference between antibody levels and potential factors (i.e., disease severity, sex, and age). *p < 0.05; **p < 0.01; ns, not significant; N, number.

