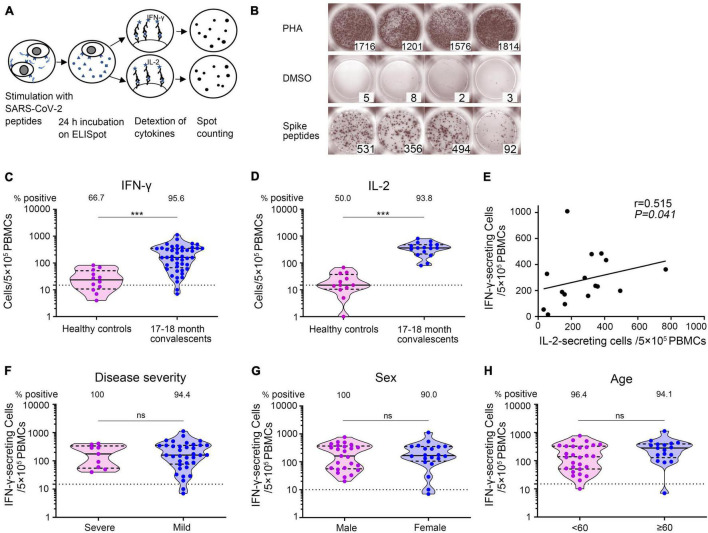
FIGURE 6.
SARS-CoV-2-specific T-cell responses 17–18 months after COVID-19 onset. (A) Schematic of memory T-cell ELISpot assay. (B) Representative ELISpots from COVID-19 convalescent patients 17–18 months after illness onset with SARS-CoV-2 spike S1 and S2 mixture peptides as the specific stimulus, DMSO as the negative control, and PHA as the positive control. The numbers in the lower right corner represented the spots counting. (C,D) The total number of SARS-CoV-2-specific IFN-γ- secreting T cells and IL-2 secreting T cells per 5 × 10⁵ PBMCs. Each dot represents an individual patient. Bars represent the median and interquartile range (IQR). Statistical significance was determined using the Mann–Whitney U-test, and represented as ***p < 0.001. (E) Correlation of SARS-CoV-2-specific IFN-γ-secreting T cells and IL-2-secreting T cells 17–18 months after illness onset (N = 16). A two-sided Spearman rank correlation test was used to evaluate the correlation of the two cytokines. (F–H) IFN-γ-secreting T cells of COVID-19 patients according to disease severity (F), sex (G), and age (H). Multivariate generalized linear models were used to compare the difference between IFN-γ spots and potential factors (i.e., disease severity, sex, and age). The dotted horizontal line represents the threshold for positive in this assay. ***p < 0.001. PBMCs, peripheral blood mononuclear cells; DMSO, dimethyl sulfoxide; PHA, phytohemagglutinin.

