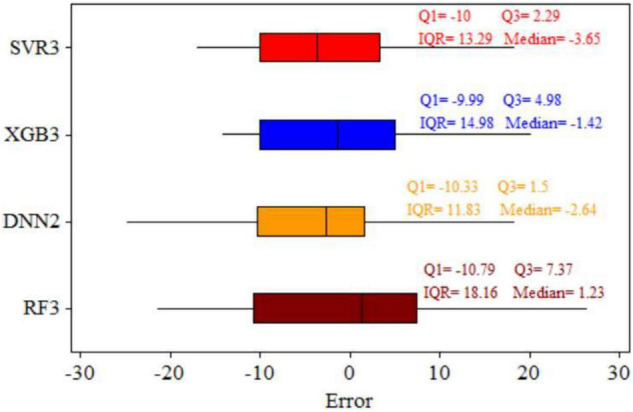
FIGURE 5.

Boxplots showing the distribution of the estimation errors in the test stage for support vector regressor (SVR), extreme gradient boosting (XGB), deep neural network (DNN), and random forest (RF) models. Q25, lower quartile of errors; Q75, upper quartile of errors; IQR, interquartile range for each model.
