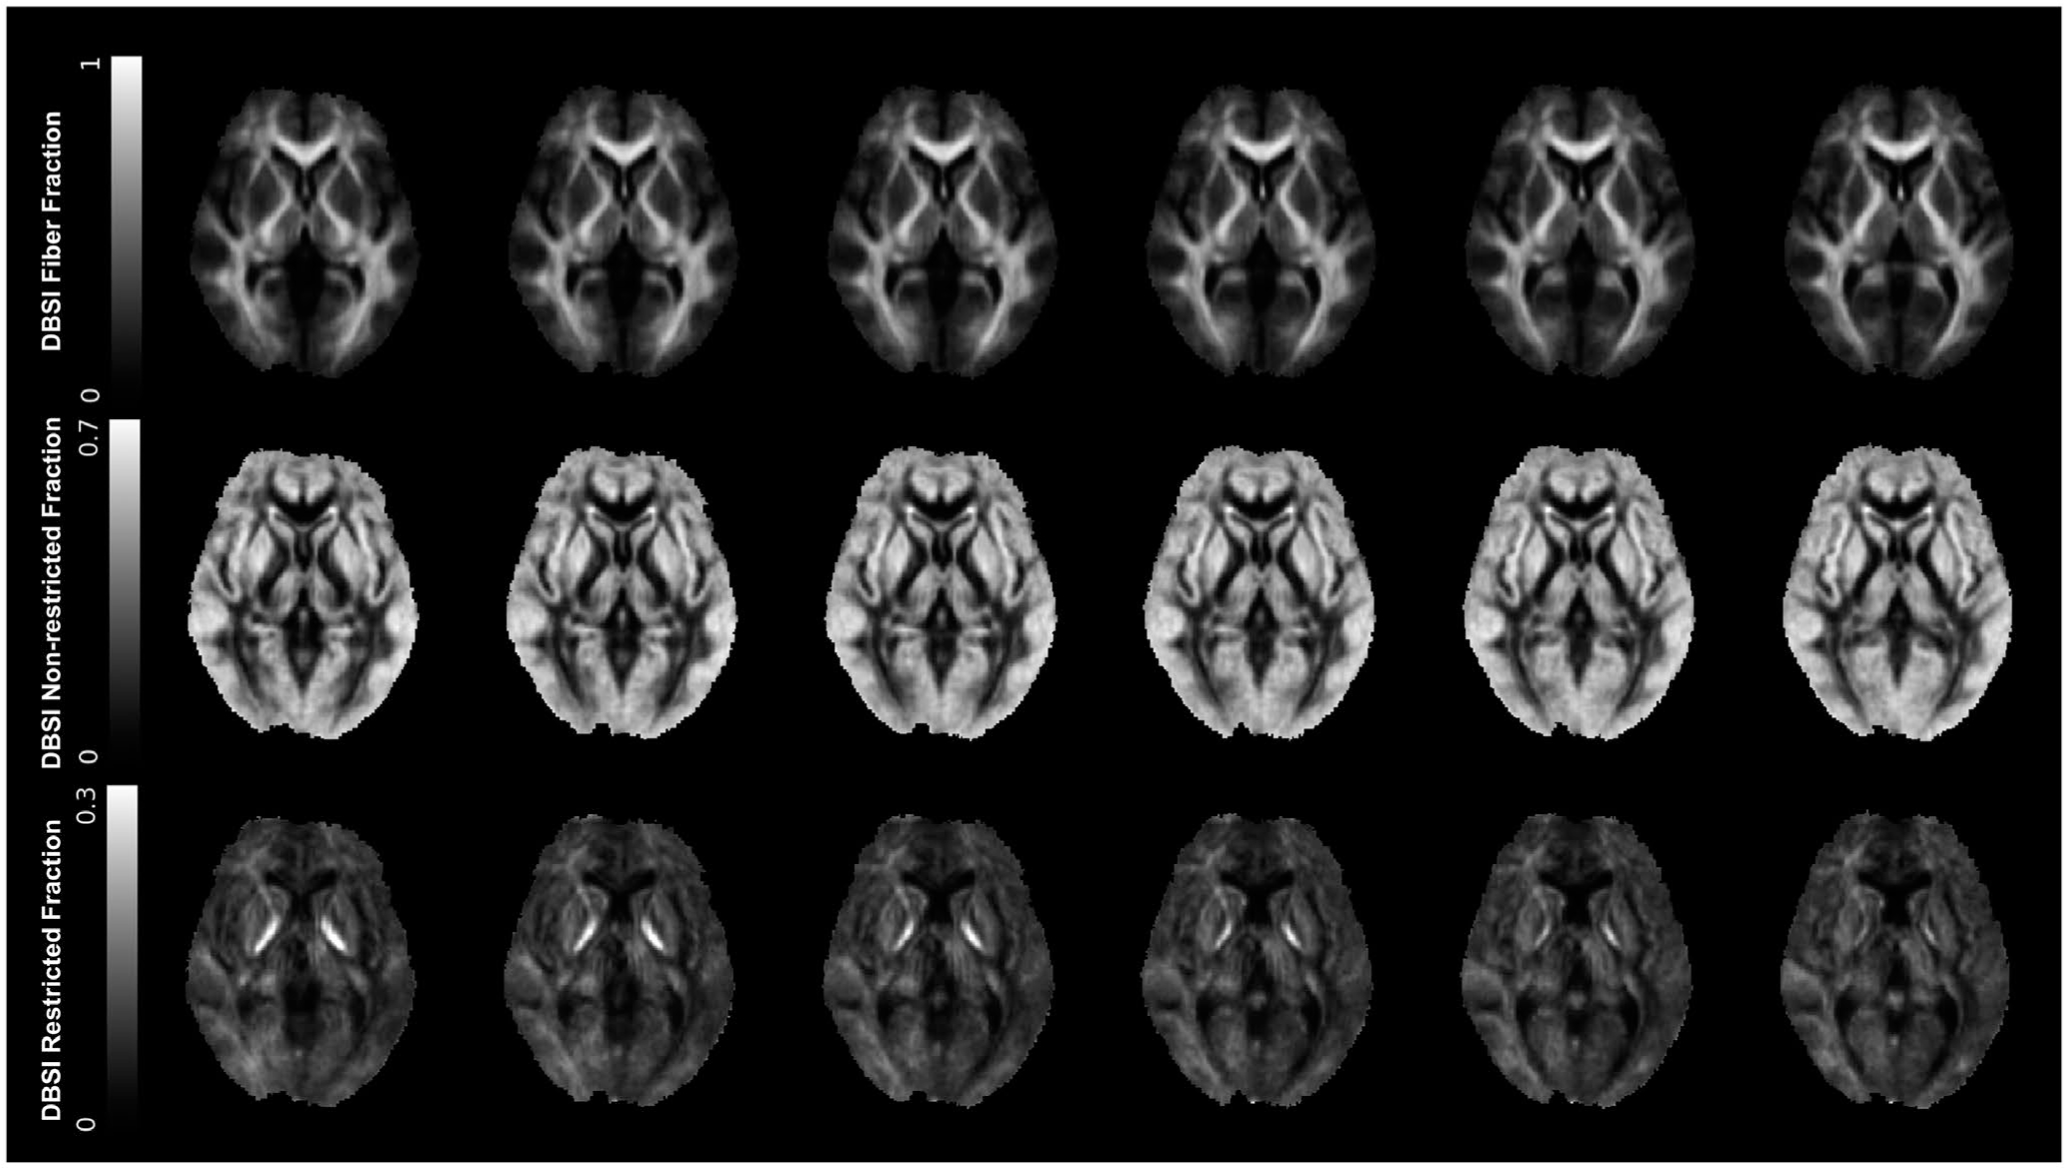
FIGURE 1.

Average DBSI from the normal-weight group (n = 21). DBSI fiber fraction (top row) is an indicator of anisotropic water diffusion or apparent axonal/dendrite density, and it shows the highest intensity in white matter tracts. DBSI nonrestricted fraction (middle row) is an indicator of isotropic extracellular water diffusion or tissue edema. DBSI restricted fraction (bottom row) is an indicator of intracellular isotropic restricted diffusion or increased tissue cellularity. DBSI, diffusion basis spectrum imaging
