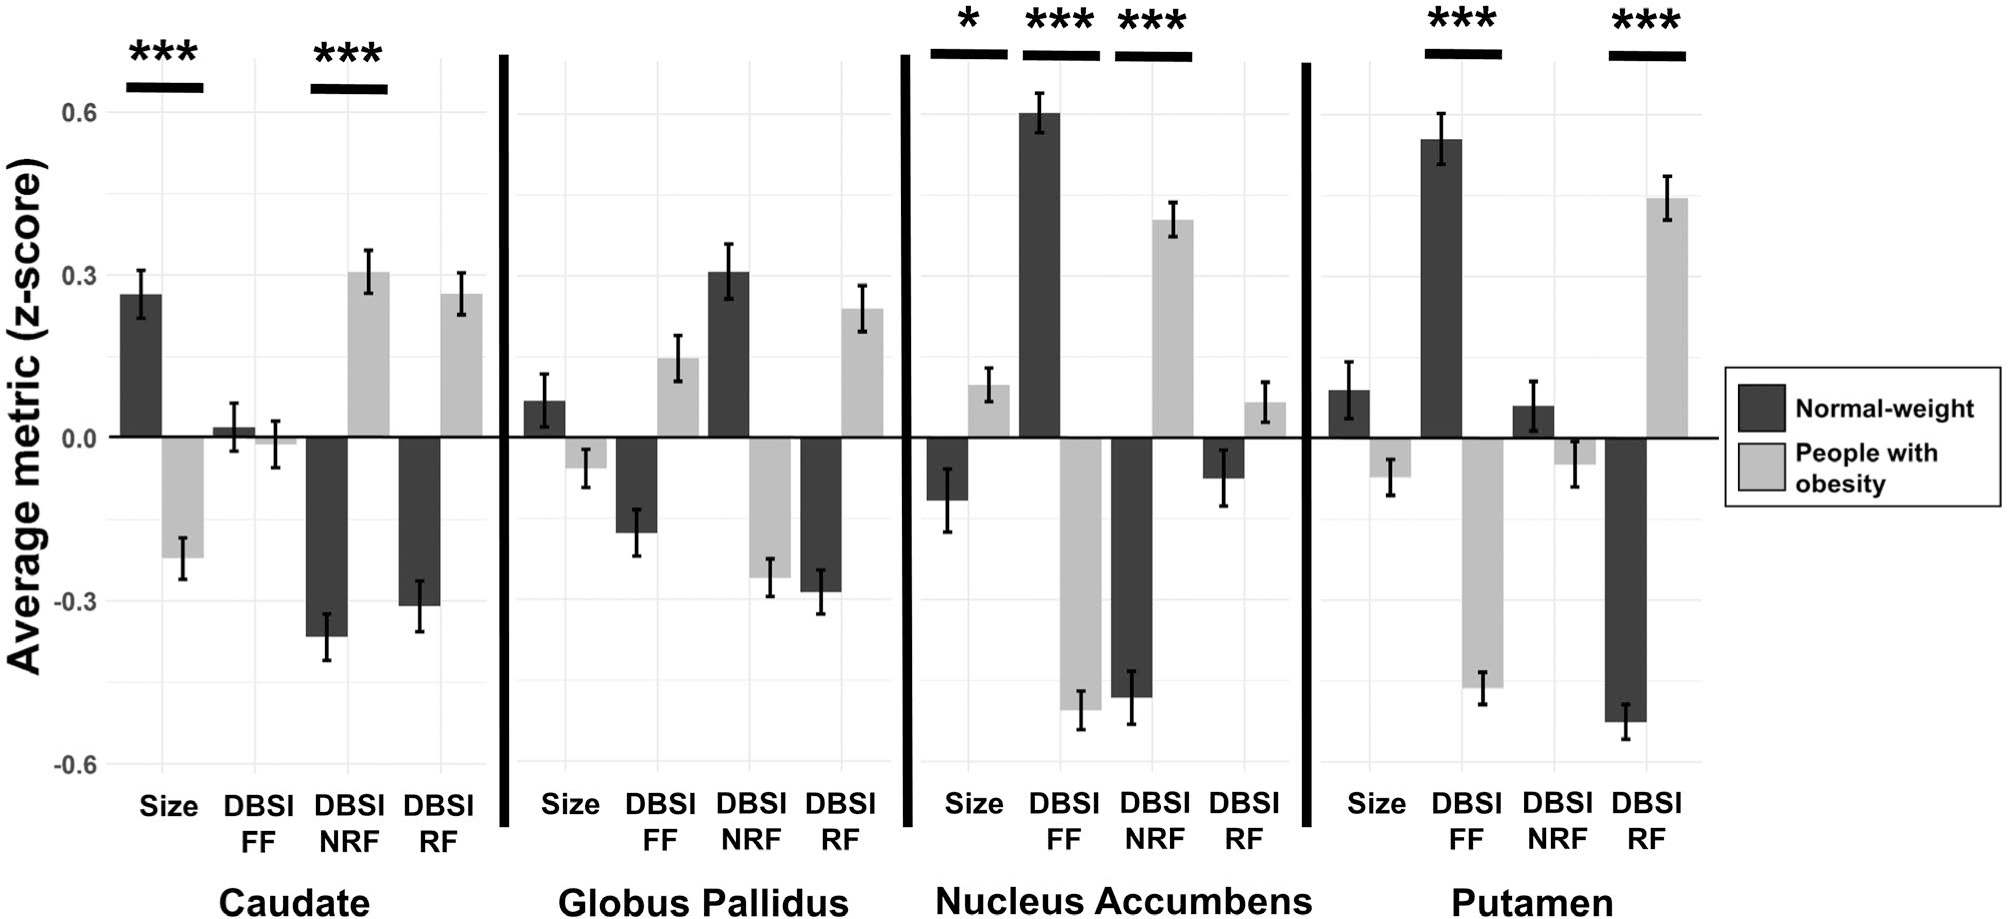
FIGURE 2.

Comparison of basal ganglia volumes and microstructure between people with obesity and people with normal weight. Volumes are corrected for total intracranial volumes. For scaling, average volume and DBSI metrics in regions of interest were converted to z scores. Error bars, mean ± SE. *p ≤ 0.05 and *** p ≤ 0.01 relative to normal-weight group. DBSI, diffusion basis spectrum imaging; FF, fiber fraction; NRF, nonrestricted fraction; RF, restricted fraction
