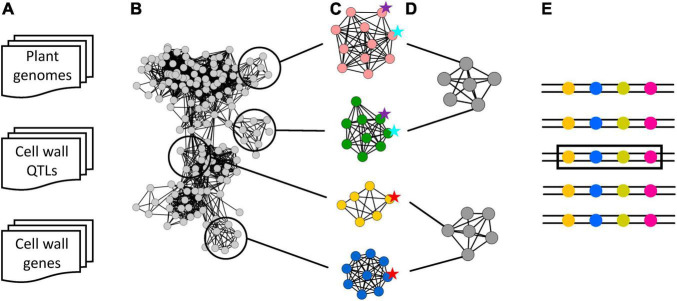
FIGURE 2.
The pipeline followed for detecting syntenic cell wall QTLs (SQTLs). (A) The starting data sets of 151 angiosperm genomes, of 610 cell wall QTLs from 8 diverse plant species, and of ∼250000 candidate cell wall genes identified across all the genomes of the study. (B) A synteny network of QTL genes across the species of the study was created, where each node (gray circles) represents a gene and black edges represent syntenic connections between genes. (C) Syntenic communities grouping the members of specific gene families that are syntenic across (groups of) plants were detected and annotated for the initial cell wall QTLs harbored by (some of) their members. Colored circles represent genes, and circles with the same color are genes belonging to the same syntenic community. Colored stars represent initial cell wall QTLs, with different colors indicating different initial cell wall QTLs. (D) Syntenic communities were clustered into SQTLs based on similarity of the cell wall QTLs harbored by each community. A SQTLs network was therefore obtained, where each node represent a syntenic community (gray circles), black edges between communities indicate a similarity >0.6 between two syntenic communities in terms of cell wall QTLs harbored by them. (E) Representation of the genomic meaning of SQTLs. Each double strip with circles represents the genome of a species, and colored circles represent genes of different types (different colors). A SQTL represents a genomic region syntenic between multiple species (same genes in the same order) and that in at least one species spans at least (a part of) one initial cell wall QTL (black rectangle).

