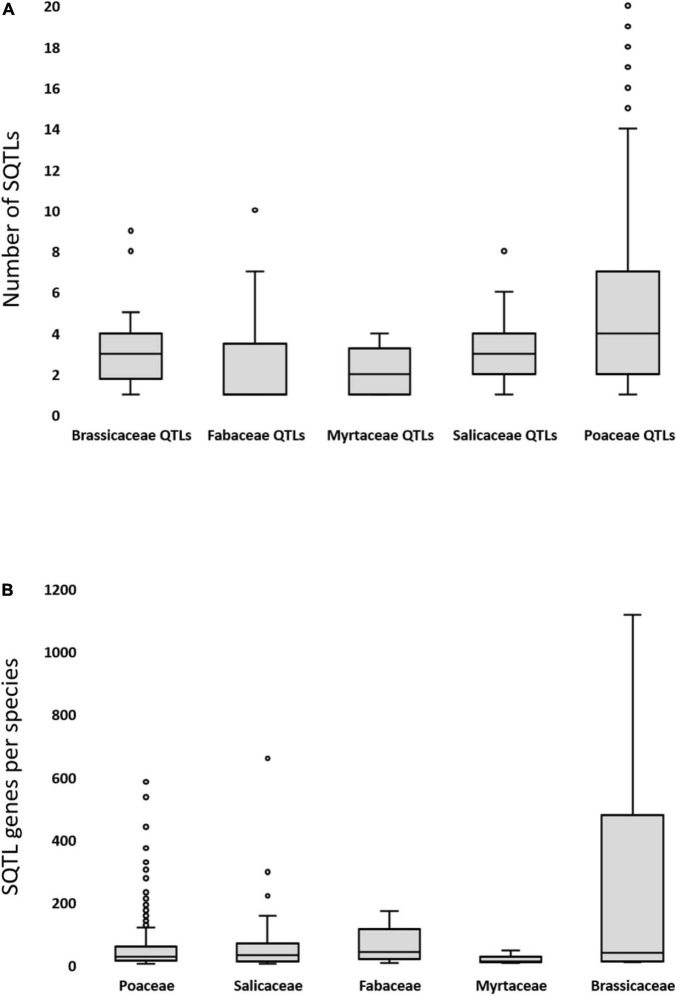
FIGURE 4.
(A) The level of fragmentation of the initial cell wall QTLs from the different groups of Table 1 over the SQTLs in which they are involved. Fragmentation is expressed as number of different SQTLs over which different parts of initial QTL resulted involved. (B) The variability of SQTL length (expressed as number of SQTL gene per species involved in a SQTL) of the SQTLs detected for the plant groups of Table 1.

