FIGURE 7.
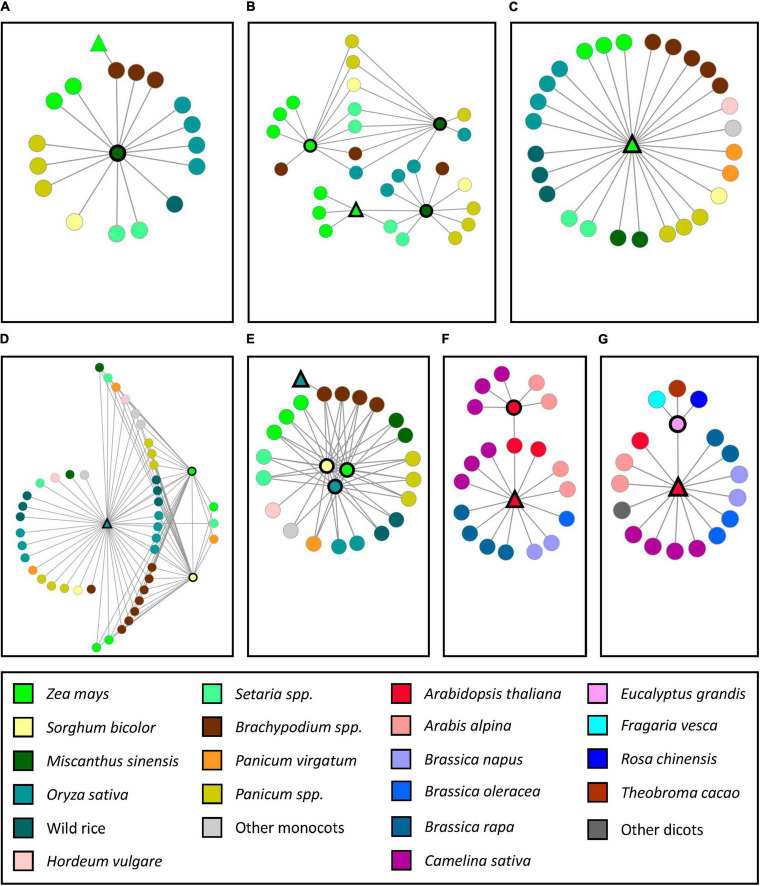
The structure of the syntenic communities of some of the monocot and dicot cell wall genes known to display allelic/mutational variation associated with variation in cell wall quality phenotypes and included in SQTLs. Each independent network represents a gene community conserved across a set of species. Network nodes indicate the gene members of syntenic communities from different species (see legend). Network nodes with black bold edges indicate genes contained within initial cell wall QTLs. Triangular nodes indicate that the gene was shown to display allelic/mutational variation associated with variation in cell wall quality phenotypes. Circular nodes are positional orthologs of those genes. (A) Zea mays Brown Midrib 1 (ZmBM1); (B) Zea mays Brown Midrib 3 (ZmBM3); (C) Zea mays Brown Midrib 4 (ZmBM4); (D) Oryza sativa Brittle culm-like 8 (OsBCL8); (E) Oryza sativa Brittle culm-like 9 (OsBCL9); (F) Arabidopsis thaliana Cobra-like 4 (AtCOBL4); (G) Arabidopsis thaliana Irregular xylem 14 (AtIRX14).

