

Abstract

A jet-stirring coupling flotation device (JSCFD) was proposed to analyze the distribution characteristics of gas holdup and bubble Sauter mean diameter (D32) in a gas–liquid system under various parameters. Results of studies suggested that the gas holdup increased with methyl isobutyl carbinol concentration, feeding pressure, and gas flow rate. The maximal gas holdup in the absence of the stirring impeller was ∼23.29% for the bubble size of 0.59 mm, which was considerably lower than the maximum gas holdup of 66.27% for the bubble size of 0.31 mm in the presence of the stirring impeller; the gas holdup was raised by ∼43% due to the bubbles torn by the stirring impeller to generate extensive smaller size bubbles and increase the content of small bubbles, and increasing the stirring impeller speed was conducive to reduce the bubble size and increase the gas holdup in JSCFD. Compared to traditional flotation machines, the size of bubbles generated by JSCFD was smaller, and the gas holdup distribution conforms to the following order: JSCFD > mechanical flotation machine > column flotation, which demonstrated that the JSCFD had a noticeable effect on increasing the gas holdup and reducing the bubble size.
1. Introduction
Flotation is a widely used and effective method for treating fine coal slime,1,2 and the flotation machine is the main equipment for completing this process.3 During the flotation process, useful mineral particles are adsorbed onto the surface of bubbles and transferred to a foam layer to become a product;4,5 therefore, the yield of the product was determined by the size and number of bubbles in the flotation cell.6 The bubble size is an important parameter for evaluating the gas dispersion capacity of a flotation machine.7 The gas holdup distribution is considered as a macroscopic representation of entire bubbles in a flotation cell, which plays a vitally important role in evaluating the flotation recovery and grade,8 and thereby, the gas dispersion of the flotation machine is evaluated in terms of the gas holdup.9,10
It has been revealed that the bubble size was much larger at the concentration lower than the critical coalescence concentration (CCC), and coalescence behaviors of bubbles can be prevented at frother concentration exceeding CCC.11 For different frother systems, the rise velocity of a 1.45 mm diameter bubble was measured to make sense of the variance in the gas holdup, which demonstrated that the gas holdup comprehensively investigated the parameters such as the bubble rise velocity, bubble size, and frother type.12 Therefore, the gas holdup is used to characterize the difference in the performances of different frothers; the results showed that the ranking by gas holdup gave the same result as that by other more complex frother characterization techniques, and the gas holdup increases with the frother concentration until CCC, above which the gas holdup remains largely constant, and it decreases with the bubble size.13 Moreover, the gas holdup determines the bubble surface area flux in the flotation column;14,15 the bubble surface area flux is a major indicator for evaluating the flotation kinetics of flotation equipment, which is directly related to the flotation efficiency. The bubble surface area flux is limited to a narrower range of values with a rather low upper limit for mechanical flotation machines; that is, the gas holdup cannot be increased beyond a certain value, thus limiting any further improvement in the efficiency of the machine.16 The measurement of gas holdup is significant for evaluating the flotation efficiency of floatation equipment. Currently, many technological means have been proposed for analyzing the gas holdup in a flotation cell, such as γ-ray computed tomography,17 ultrasound-conductivity method,18 volume expansion method,19 local gas holdup measurement devices,16 and some new types of measuring technologies.20,21 Among the various techniques, the pressure difference technique is a simple and widely used method for gas holdup.22,23
Currently, there are three main types of flotation machines widely used in mineral processing, namely, mechanical flotation machine, Jameson cell, and flotation column. The rotor–stator mechanism of the mechanical flotation machine is advantageous for dispersing gas in the flow field; however, the size and number of bubbles were determined by the rotor–stator mechanism.24,25 The Jameson cell intakes air via the difference in velocity between the jet and gas flows, and the dispersion of the air in the cell is related to the free jet length and jet velocity.26,27 The flotation column is a relatively simple flotation device that produces a suitable gas dispersion through a bubble generator.28,29 Most previous studies focused on improving the flotation performance of conventional flotation machines; studies on combining the characteristics of common flotation machines to design a new type of flotation device and conducting performance tests are limited.30
In this paper, a new jet-stirring coupling flotation device (JSCFD) was proposed. The influences of feeding pressure (P, MPa), methyl isobutyl carbinol (MIBC) concentration (C, mg/L), gas flow rate (q, m3/h), and stirring impeller on the gas holdup and bubble size in the JSCFD were investigated in a measurement system. The performance of the device in a dispersing gas, in terms of gas holdup and bubble size, was evaluated.
2. Experimental Section
2.1. Structure of JSCFD
Figure 1 shows the structure of the JSCFD, which mainly is composed of six primary components including double cosine self-aspirated nozzle, driving impeller (30 mm width ×35 mm length ×150 mm diameter), stirring impeller (25 mm width ×70 mm length ×150 mm diameter), mixing tank (90 mm height ×160 mm diameter), draft tube (247 mm height ×70 mm diameter), and canopy hood (40 mm height ×70 mm diameter ×160 mm diameter). The double cosine self-aspirated nozzle is arranged along the tangential direction of the mixing tank, and the jet direction of the double cosine self-aspirated nozzle is perpendicular to the radial direction of the central position of the driving impeller, as shown in Figure 1A-A.31
Figure 1.

Schematic of the JSCFD.
Figure 2 shows the structure of the double cosine self-aspirated nozzle. The nozzle structure primarily consists of three parts: ejector pipe with the outlet diameter d of 6 mm, outer nozzle with diameter D of 7 mm, and suction pipe. The distance of outlet between the outer nozzle and ejector pipe is L of 20 mm. The rest of more detailed structural dimensions can be referred to in Table 1 of the reference.31 The space between the outer nozzle and ejector pipe is the suction zone, wherein air is inhaled from the outside owing to the velocity discrepancy between the coal slurry and air flow. Subsequently, three-phase blending occurred in the mixing zone.
Figure 2.

A double cosine self-aspirated nozzle.
Table 1. Comparison of Gas Dispersion Parameters in Different Flotation Devices.
| flotation devices | experimental reagents | methods | maximum gas holdup (%) | D32 (mm) |
|---|---|---|---|---|
| flotation column9 | MIBC = 0.11 mmol/L; F150 = 0.05 mmol/L | McGill bubble viewer; differential-pressure method | 9.8; 13.4 | 1.1; 0.7 |
| continuous bubble column47 | hexanol/PO molar mixing ratio = 1/0.1, 60 ppm | McGill bubble size analyzer; conductivity method | 11.9 | 1.0 |
| cyclone-static microbubble flotation column48 | P = 0.34 MPa; Qg = 2.50 m3/h; pine oil = 10, 15, 20 mg/L; D = 6 mm | differential-pressure method | 12.14; 12.54; 12.8 | |
| column flotation cell49 | Jg = 1.47 cm/s; MIBC = 10, 20, 30 ppm | differential-pressure method | 9; 13; 18 | 2.06–1.04; |
| downflow column13 | MIBC = 8.1 mg/L; Jg = 1.32 cm/s | viewing system; drainage method | 21 | 0.65 |
| industrial flotation cell50 | freon 13B1 as gas tracer | local gas holdup measurement | 8.8 | |
| laboratory Denver flotation cell44 | MIBC = 22.4 ppm; Jg = 0.9 cm/s; impeller peripheral speed = 4, 5, 6 m/s | McGill bubble viewer; drainage method | 8; 13; 24 | 0.43–0.11 |
2.2. The Principle of Inspired Gas
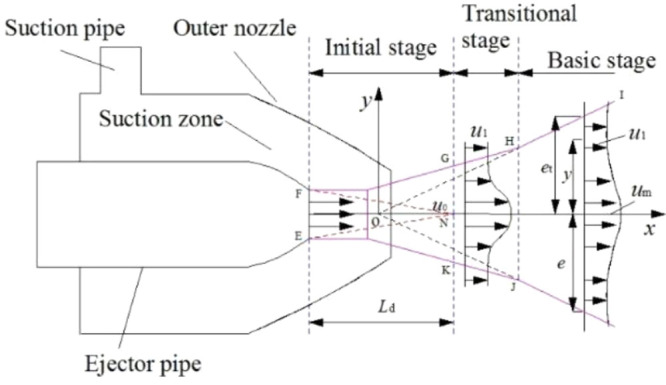
Figure 3 shows the schematic diagram of the principle of inspired gas. The ejector pipe ejects a high-pressure free fluid, a violent interaction occurs among the jet fluid and the surrounding fluid (such as the air medium flow), and the result is an unstable vortex on the outer boundary of the jet beam. The vortexes have different sizes; larger vortexes transport energy, and smaller vortexes dissipate energy. The exchange of mass, energy, and temperature among fluid particles occurred on the boundary layer at all times due to the random and chaotic movement of the vertex.
Figure 3.
Principle of inspired gas of the double cosine self-aspirated nozzle.
EN and FN are called the inner boundary of the jet, FGHI and EKJ are called the outer boundary of the jet, the area between the inner and outer boundaries of a free fluid is called the boundary layer, the longitudinal width of the free jet boundary layer is the thickness of boundary layer, which is expressed as 2e, and the half-width of the jet boundary layer is marked as e, where e = 0 at the nozzle outlet; the boundary layer thickness 2e gradually increases as the spray distance increases, which means the jet beam diverges. The intersection of the opposite extension of the outer boundary of the jet in the basic stage is denoted as the jet pole O.
The free jet generally consists of three stages, namely, the initial stage, transitional stage, and basic stage. The initial velocity of the primary jet is expressed as u0, the secondary jet velocity is u1 (u0 > u1), and the center velocity of the jet is named um. This jet velocity in the conical region of EFN is u0, indicating that this region is a constant velocity nuclear region; the length of the constant velocity nuclear region is expressed as Ld, and um reduces as the jet distance grows, which indicates that the energy of the jet water beam gradually decreases. Therefore, the distance between the driving impeller and the double cosine self-aspirated nozzle should be shortened as much as possible when arranging the relative position between the two, so as to make full use of the kinetic energy of the jet for impacting the rotational movement of the driving impeller. The GK section to the HJ section is the transitional stage; the basic stage is located behind the HJ section, and the fluid in this jet stage fully exhibits turbulent characteristics. The shearing effect between the jet fluid and the external fluid is due to the existence of the viscous force; the external fluid will be entrained by the jet fluid into the jet beam and mixed and dissolved in the mixing area in the nozzle. The mathematical relationship between the jet boundary layer thickness 2e and the nozzle outlet diameter D directly affects the suction performance.32
The self-modularity of the velocity distribution in each section of the main section where the jet is fully developed is exponential.33
 |
1 |
where y is the jet section radius.
Under a jet beam of water, via adjusting the nozzle distance L to promote the following relationship between 2e at the outer nozzle outlet section and the outer nozzle outlet diameter D, the following results can be obtained.
-
①
When 2e ≪ D, the outlet of the outer nozzle cannot be effectively sealed by the divergent jet beam, so it is difficult to form a stable negative pressure condition in the suction zone.
-
②
When 2e < D, a weak negative pressure condition can be formed in the suction zone, and the suction capacity is still weak.
-
③
When 2e = D, the outlet of the outer nozzle is just sealed by the divergent jet beam, a more stable negative environment can be formed in the suction zone, and the ability of ejecting air is better in this case.
-
④
When 2e > D, the outlet of the outer nozzle can be effectively sealed by the divergent jet beam and a small amount of jet water beam stays in the mixing zone for a short time, so a more stable negative environment can be formed in the suction zone, which is conducive to ejecting air flow.
-
⑤
When 2e ≫ D, a large number of water bundles stay in the suction zone, the volume space of the suction zone was compressed, even sucked into the suction pipe due to a large amount of water that cannot be discharged to the outside from the nozzle outlet in time, and the negative pressure environment formed is weak.32
2.3. Experimental System
Figure 4 shows the gas–liquid two-phase experimental setup used to measure the gas holdup. It generally comprises six components: (1) a circulation pump for pumping the water medium, (2) a frequency converter (type: ACS510-01, obtained from ABB Co., Ltd.) for controlling the operating frequency of the circulation pump, that is, controlling the feeding pressure of the nozzle, (3) a three-phase motor (type: YS6314, obtained from Zhejiang Zuofan Motor Co., Ltd.) equipped with the frequency convertor (type: VCO BOP-2, obtained from Zhejiang Zuofan Motor Co., Ltd.) for controlling the speed of impeller, (3) a pressure gauge for monitoring the feeding pressure, (4) a fluid flowmeter for monitoring the liquid flow rate (Q, m3/h), (5) a gas flowmeter for monitoring and controlling the gas flow rate, and (6) a circulation tank for circulating the water medium and arranging the flotation device equipped with a false bottom at the bottom of the cell.
Figure 4.

Schematic of the gas holdup and D32measurement system.
The dimensions of the circulation tank are 250 mm (width) × 250 mm (length). A vertical downward coordinate axis marked as H was established for indicating the water depth away from the liquid level, with the origin at the same height as the liquid level (H = 0 cm).
2.4. Reagent
MIBC (C6H14O; molecular weight: 102.18 g·mol–1, Shanghai Hansi Chemical Co., Ltd.) was used as the frother.
2.5. Measurements and Data Processing
The pressure difference technique was used in this study for measuring the distribution of the gas holdup in the circulation tank; two pressure sensors (named as 1# and 2#, obtained from Hangzhou Sinomeasure Automation Technology Co., Ltd.; the precision of these sensors is 0.2%) are arranged on one side of the groove from top to bottom, as shown in Figure 4. The 1# sensor is 15 cm from the liquid level, and the distance between these two sensors is 10 cm. A signal acquisition card (from Morpheus Electronics Technology Co., Ltd., was used for recording the data from the two sensors and displaying the data in real time on a computer. To improve the accuracy of the measurement data, the data were collected after the system attained a steady condition, as determined by the stable fluid level readings. The local gas holdup distribution was analyzed from the pressure difference between 1# and 2#; that is, the water depth (H) is 20 cm. In this study, the gas holdup at a water depth of 20 cm was used to reflect the gas holdup stably because the measurement error caused by the complex flow field near the impeller can be greatly reduced. The pressure data collected by each sensor were no less than 105 per group, from which the average pressure value was calculated; the frequency of measurement was 4000, and the duration of measurement was 3–4 s. The tests were performed at pH of 7.0 and temperature of 10 ± 1 °C. The gas holdup test was conducted in a single nozzle.
A McGill bubble size analyzer used to collect bubbles was presented in Figure 4.34 The D32 measurement system primarily consists of a high-speed camera (Olympus UK Ltd., model i-SPEED 3) used to record the bubble image of 4000 fps;31 a view chamber equipped with light filter and light source was set to disperse the bubble clusters for clear identification of bubble boundaries, and a tubular sampling tube of 5 mm was used to collect the bubbles in the middle position of the two pressure sensors. The bubbles were transferred to the view chamber together with the solution, and the bubble images collected by a high-speed camera were processed by Image-pro-plus software to obtain the Sauter mean diameter.4Figure 5 presents the bubbles generated by the flotation device.
Figure 5.

Bubbles generated by a flotation device.
The gas holdup was calculated from the pressure using the following equation (eq 2)
| 2 |
where ΔP is the pressure difference between two measurement points separated by a vertical distance ΔH, ρs is the slurry density, and g is the acceleration due to gravity.35,36
The D32 is generally used to evaluate the mean value of the bubble group, which was determined using eq 3(25,37)
| 3 |
where n is the sum of sampling bubbles, and di means the diameter of the ith bubble.
3. Results and Discussion
3.1. Effect of MIBC Concentration on Gas Holdup
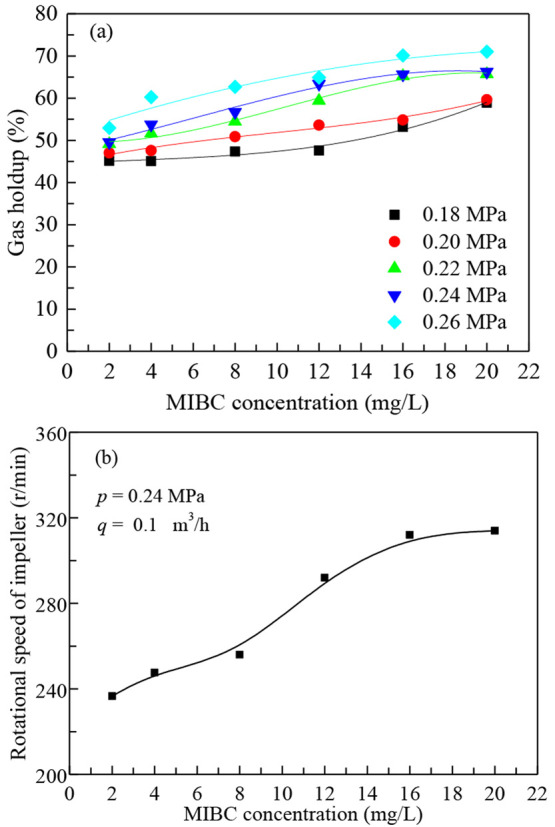
The gas holdup as a function of the MIBC concentration as q = 0.1 m3/h is shown in Figure 6a. The gas holdup increases with the MIBC concentration; the local gas holdup is as high as 66.27% at the feeding pressure of 0.24 MPa and the concentration of 20 mg/L. An increase in the MIBC concentration gives rise to the number of small bubbles and reduces the size of the bubbles.9 The decrease of bubble size led to a decrease in the rise velocity of the bubbles, and the collision damping effect between bubbles was enhanced as the bubble number increased, eventually making the bubbles remain in the flotation cell for a longer time and, consequently, increase the gas holdup.
Figure 6.
Gas holdup (a) and rotational speed of impeller (b) as functions of the MIBC concentration.
The relationship between the speed of the impeller and MIBC concentration is shown in Figure 6b. The impeller rotational speed increases with increasing concentration. The increase of impeller speed is essentially due to the decrease of pressure difference caused by the measured space filled with most of the microbubbles, which directly causes the decrease of hydrostatic pressure and frictional resistance of the liquid medium on the stirring impeller, thus improving the turbulence of the flow field near the stirring impeller,38 which is beneficial to the improvement of particle-bubble collision mineralization efficiency.39,40
3.2. Effect of Feeding Pressure on Gas Holdup
Figure 7a shows the gas holdup as a function of the feeding pressure when q = 0.1 m3/h at various MIBC concentrations; the gas holdup increases at each MIBC concentration with increasing feeding pressure. A higher concentration produces higher gas holdup. Figure 7b shows the liquid flow rate and impeller speed as a function of the feeding pressure at a concentration of 2 mg/L. A strong positive linear relationship is observed between the liquid flow rate, impeller speed, and feeding pressure. The liquid flow rate was raised owing to the feeding pressure, thus increasing the velocity of the jet flow and consequently increasing the rotational speed of the impeller.
Figure 7.

Effect of feeding pressure on (a) gas holdup, (b) liquid flow rate, and rotational speed of the impeller.
As noted above, the velocity contrast between the gas and liquid flows increases with feeding pressure in the case of a constant gas flow rate. The gas–liquid interaction frequency in the mixing zone was enhanced because of the increase in the jet flow velocity, which contributed to breaking down the large bubble micelles into smaller bubbles and dissolving in the liquid phase; in addition, the bubble size was reduced again,31 and the dispersion of the gas in the liquid phase was enhanced because of the increase in the impeller speed.41
3.3. Effect of Gas Flow Rate on Gas Holdup
Figure 8a illustrates the relationship between gas holdup and gas flow rate when P = 0.24 MPa at various MIBC concentrations. The gas holdup exhibits an increasing trend along with the gas flow rate. It is noteworthy that the gas flow rate is less than 0.15 m3/h; the gas holdup has little change with increasing gas flow rate at each concentration curve, until this rate exceeds 0.15 m3/h and the concentration is below 16 mg/L, when the gas holdup is raised rapidly in the wake of gas flow rate addition.
Figure 8.

Effect of gas flow rate on (a) gas holdup and (b) the rotational speed of the impeller.
Figure 8b shows the rotational speed of the impeller as a function of the gas flow rate at different concentrations. Combined with the measurement results of the rotational speed of the impeller, it can be concluded that the rotational speed of the impeller increases along with the gas flow rate. The rotational speed of the impeller increases faster with the increase in the gas flow rate at concentrations of 4, 8, and 12 mg/L; however, the rotational speed of the impeller remains largely unchanged at concentrations of 16 and 20 mg/L, which give rise to the gas holdup that varies slightly with increases in the gas flow rate. The increase of gas holdup caused by the gas flow rate is due to the increase of impeller speed under the condition of constant feeding pressure, because a significant surface tension gradient was easily formed on the surface of bubbles due to the flow field fluctuation caused by the impeller rotation at a lower frother concentration, which promotes the formation of small bubbles from large bubbles.42 However, the bubble surface tends to be saturated with the frother molecules in the case of higher frother concentration, the surface tension gradient barrier of the bubble is difficult to be changed by the flow field disturbance caused by rotational speed, and the gas flow rate plays a major role in the change of gas holdup rather than impeller rotational speed.43
3.4. Effect of the Stirring Impeller Speed on Gas Holdup and Bubble Size
According to Figures 7b and 8b, it is found that the rotational speed of the impeller changes with the variation of process variables during the experiment, which interferes with the analysis results of the influence of process variables on gas holdup. The impeller speed of 236 r/min at the concentration of 2 mg/L, the feeding pressure of 0.24 MPa, and gas flow rate of 0.1 m3/h were the conditions used for the constant speed experiment, and the influence of various factors on gas holdup and D32 under the conditions of 236 r/min and variable speed was compared and analyzed for the purpose of revealing the influence of process variables on the gas holdup. Figure 9 shows a comparison between the variable speed and constant speed (236 r/min) of the impeller on gas holdup and D32 in the flotation device at various operation parameters: (a) MIBC concentration (P = 0.24 MPa, q = 0.1 m3/h), (b) feeding pressure (C = 8 mg/L, q = 0.1 m3/h), and (c) gas flow rate (C = 8 mg/L, P = 0.24 MPa). The speed values in the case of variable speed were marked in Figure 9.
Figure 9.

Comparison between variable speed and constant speed (236 r/min) of an impeller on the gas holdup and D32 in a flotation device at various operation parameters. (a) MIBC concentration (P = 0.24 MPa, q = 0.1 m3/h), (b) feeding pressure (C = 8 mg/L, q = 0.1 m3/h), and (c) gas flow rate (C = 8 mg/L, P = 0.24 MPa).
As shown in Figure 9a, the D32 decreases while the gas holdup increases with increasing MIBC concentration; the higher rotational speed leads to a smaller bubble size, so the gas holdup is increased in the flotation cell, and the higher the difference of rotational speed between the variable speed and constant speed (236 r/min), the greater the difference of gas holdup and bubble size measurement results. The rotational speed of the variable test was 199, 213, 225, 236, and 247 r/min, and the maximum and minimum speed differences were 37 and 0 r/min; that is, the speed difference is relatively small, which has little effect on the change of bubble size and gas holdup. However, it can still be concluded that a higher rotational speed results in smaller bubbles and higher gas holdup under the same feeding pressure; on the contrary, the bubble size is larger and the gas holdup is lower at the lower rotational speed, as shown in Equation 4.44 Similarly, the same conclusion can be drawn from Figure 9c under the same gas flow rate. The comprehensive analysis shows that the bubble size was reduced and the gas holdup was improved by increasing the impeller speed. A study had shown that there were more small bubbles near the impeller and the state of gas dispersion in flotation cell tends to be uniform with increases in the impeller speed.39
| 4 |
where JG is the superficial gas rate (cm/s), NS is the impeller peripheral speed (m/s), and Pd is the pulp density (%).
3.5. Effect of the Stirring Impeller on Gas Holdup and Bubble Size
Figure 10 displays the gas holdup and D32 as functions of various process variables. Figure 10a represents the gas holdup and D32 as functions of the MIBC concentration when P = 0.24 MPa and q = 0.1 m3/h. Figure 10b represents the gas holdup and D32 as functions of the feeding pressure when C = 8 mg/L and q = 0.1 m3/h. Figure 10c represents the gas holdup and D32 as functions of the gas flow rate when C = 8 mg/L and P = 0.24 MPa. Figure 11 shows a comparison of the rotational speed of the impeller when C = 8 mg/L and q = 0.1 m3/h with or without the stirring impeller. Figure 12 shows the effect of the stirring impeller on the content of each bubble size when C = 8 mg/L, P = 0.24 MPa, and q = 0.1 m3/h.
Figure 10.
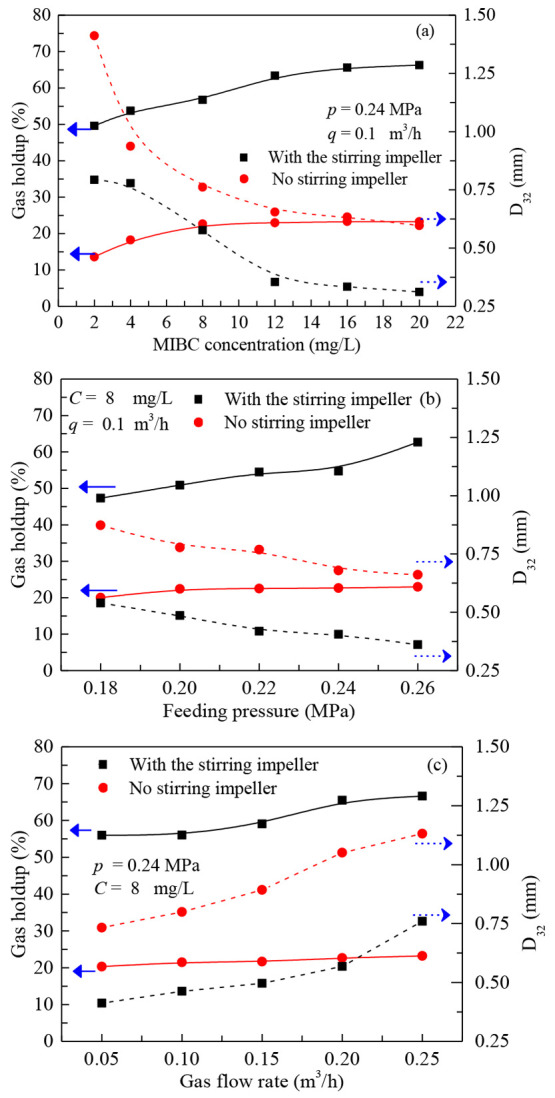
Effect of stirring impeller on the gas holdup and D32 in terms of process variables. (a) MIBC concentration, (b) feeding pressure, and (c) gas flow rate.
Figure 11.

Rotational speed of the stirring impeller as a function of the feeding pressure in different flotation structures.
Figure 12.

Effect of the stirring impeller on the content of each bubble size.
Figure 10a–c indicate that the gas holdup in the presence of the stirring impeller is obviously higher than that in the absence of the stirring impeller at each experiment; the gas holdup increases gradually with the MIBC concentration, particularly in the absence of the stirring impeller, until a concentration of 11.2 mg/L,9,13 above which the gas holdup increment decreased significantly. The maximum gas holdup from the experimental data in the absence of the stirring impeller is ∼23.29%, which is much less than that of 66.27% in the presence of the stirring impeller; that is, the gas holdup increased by 43% due to the stirring impeller. According to Figure 10, the D32 value gradually decreases with increasing MIBC concentration and feeding pressure, in contrast, which increases with the increase of gas flow rate; that is, smaller bubbles cause higher gas holdup. As shown in Figure 11, even though the driving impeller speed without the stirring impeller is greater than that with the stirring impeller, there is no obvious influence on increasing the gas holdup, which is further proof that the structure of the stirring impeller in the flotation cell is conducive to reduce the bubble size and improve the gas holdup.45
As shown in Figure 12, the peak value of 35.85% in the curve of the stirring impeller was higher than that of 25.05% without the stirring impeller, indicating that the number of small bubbles of 0.35 mm generated by JSCFD in the presence of the stirring impeller was more than that of 0.56 mm the flotation machine without a stirring impeller structure. The rise in the velocity of bubbles was reduced because of the decrease in the bubble diameter, thus increasing the residence time of the bubbles and promoting the gas holdup in the flotation cell.12 It is noted that the turbulence intensity in the flotation cell is improved due to the shearing action of the stirring impeller, which is beneficial to disperse air into small bubbles and provided a better flow-field condition for bubble mineralization.41,46eqs 5 and 6(25) describe the relationship between the flotation efficiency with D32 and bubble surface area flux (SB), in which the gas dispersion plays a role through both the mechanical process (JG/D32) and particle collection (EC × EA). The surface area flux is in reverse ratio to the bubble diameter. The small bubble diameter improves the bubble surface area flux and gives a rise to the gas holdup. Finally, the flotation rate constant was improved.
| 5 |
| 6 |
where k is the first-order flotation rate constant, EC is the collision efficiency, EA is the adhesion efficiency, and SB is the bubble surface area flux (s–1).
3.6. Comparative Analysis of Gas Dispersion Parameters in the Different Flotation Machines
Table 1 shows the comparison analysis of gas dispersion parameters in different flotation systems. Clearly, the D32 distribution is in the limits of 1.04–2.06 mm in the column flotation, corresponding to a gas holdup of 18%–9%; the D32 is ∼0.65 mm in the downflow column, and the gas holdup is 21%; the D32 is in the limits of 0.43–0.11 mm for the mechanical flotation machine, and the gas holdup is from 8% to 24%; as for JSCFD, when the gas holdup measurement distribution is within the range of 49.56%–66.27% near the stirring impeller, the bubble size distribution is ∼0.79–0.31 mm.31 For further research, the data in Table 1 were produced in Figure 13, which represents the relationship between the gas holdup and D32 in different flotation machines. It demonstrated that the gas holdup follows this order: JSCFD > mechanical flotation machine > column flotation; the gas holdup basically increases with the reduction of bubble size. The polynomial fitting of gas holdup and D32 under the presence of the stirring impeller was expressed in Table 2; the fitting correlation index of the quintic model was 0.9324, suggesting that the predictive model accuracy was relatively high.
Figure 13.

Relationship between gas holdup and D32 in different flotation machines.
Table 2. Polynomial Fitting Expressions of Gas Holdup and D32.
| polynomial | formula | correlation index |
|---|---|---|
| quadratic | y = 1.057 74 – 1.6292x + 1.119 69x2 | 0.7699 |
| cubic | y = 2.530 41 – 10.619 03x + 18.408 01x2 – 10.445 04x3 | 0.8518 |
| quartic | y = −2.409 39 + 31.039 06x – 108.967x2 + 156.5266x3 – 78.9773x4 | 0.9255 |
| quintic | y = −12.7142 + 136.279 04x – 527.084 11x2 + 964.3064x3 – 838.380 78x4 + 278.231 04x5 | 0.9324 |
4. Conclusions
A novel JSCFD, including the introduction of device structure and working principle, was proposed. The gas holdup and D32 were comparatively investigated in the presence and absence of a stirring impeller in the flotation device. Frother concentration, feeding pressure, and gas flow rate in the different flotation structure were studied to promote the understanding of the influence of the stirring impeller on gas dispersion. Various conclusions can be obtained, as follows.
-
(1)
The gas holdup increased in the wake of raising the MIBC concentration, feeding pressure, and gas flow rate regardless of the stirring impeller; the D32 gradually decreases along with the addition of MIBC concentration and feeding pressure, in contrast, which increases with the increase of gas flow rate. Under the same circumstances, the gas holdup with the stirring impeller is higher than that without a stirring impeller, and the corresponding bubble size is much lower than that without a stirring impeller.
-
(2)
The presence of a stirring impeller indicated that the higher the gas holdup is, the smaller the bubble size becomes. The gas holdup is 66.27% when the bubble size is 0.31 mm in the presence of a stirring impeller, compared with the absence of a stirring impeller, when the gas holdup is 23.29% with the bubble size of 0.59 mm; the gas holdup was increased more than 43%, and the content of smaller bubbles increased due to the existence of stirring impeller. In addition, the bubble size was reduced and the gas holdup was improved by increasing the impeller speed. It demonstrated that the stirring impeller had a marked impact on reducing the bubble size and increasing the gas holdup inside the flotation cell.
-
3
Compared to the traditional flotation machines, the gas holdup distribution conforms to the following order: JSCFD > mechanical flotation machine > column flotation. These results confirmed the scientific structural design and the potential industrial application of the JSCFD in the recovery of fine coal slime.
Acknowledgments
The authors gratefully acknowledge the Provincial University Natural Science Foundation of Anhui (Grant No. KJ2020A0303), the National Natural Science Foundation of China [Grant No. 52074014], and the Talent introduction foundation of Anhui University of Science and Technology [Grant No. 13200419].
The authors declare no competing financial interest.
References
- Xu M.; Xing Y.; Gui X.; Cao Y.; Wang D.; Wang L. Effect of Ultrasonic Pretreatment on Oxidized Coal Flotation. Energy & Fuels. 2017, 31 (12), 14367–14373. 10.1021/acs.energyfuels.7b02115. [DOI] [Google Scholar]
- Xing Y.; Gui X.; Pan L.; Pinchasik B.-E.; Cao Y.; Liu J.; Kappl M.; Butt H.-J. Recent experimental advances for understanding bubble-particle attachment in flotation. Adv. Colloid Interface Sci. 2017, 246, 105–132. 10.1016/j.cis.2017.05.019. [DOI] [PubMed] [Google Scholar]
- Li D.; Wang H.; Yang L.; Yan X.; Wang L.; Zhang H. Intensification effects of stirred fluid on liquid–solid, gas–liquid and gas–solid interactions in flotation: A review. Chem. Eng. Process. - Process Intensificat. 2020, 152, 107943. 10.1016/j.cep.2020.107943. [DOI] [Google Scholar]
- Zhu H.; Valdivieso A.; Zhu J.; Min F.; Song S.; Corona Arroyo M. A. Air Dispersion and Bubble Characteristics in a Downflow Flotation Column. Miner. Process. Extr. Metall. Rev. 2019, 40 (3), 224–229. 10.1080/08827508.2018.1556159. [DOI] [Google Scholar]
- Verrelli D. I.; Albijanic B. A comparison of methods for measuring the induction time for bubble–particle attachment. Miner. Eng. 2015, 80, 8–13. 10.1016/j.mineng.2015.06.011. [DOI] [Google Scholar]
- Kracht W.; Emery X.; Paredes C. A stochastic approach for measuring bubble size distribution via image analysis. Int. J. Miner. Process. 2013, 121, 6–11. 10.1016/j.minpro.2013.02.016. [DOI] [Google Scholar]
- Deng X.; Xing B.; Liu J.; Zhang C.; Shi C.; Lu Y. Bubble size distribution in cyclonic zone of a novel flotation column. Sep. Sci. Technol. 2017, 52 (9), 1–8. 10.1080/01496395.2017.1295072. [DOI] [Google Scholar]
- LóPez-Saucedo F.; Uribe-Salas A.; Pérez-Garibay R.; Magallanes-Hernández L. Gas dispersion in column flotation and its effect on recovery and grade. Can. Metall. Q. 2012, 51 (2), 111–117. 10.1179/1879139511Y.0000000033. [DOI] [Google Scholar]
- Tan Y. H.; Rafiei A. A.; Elmahdy A.; Finch J. A. Bubble size, gas holdup and bubble velocity profile of some alcohols and commercial frothers. Int. J. Miner. Process. 2013, 119, 1–5. 10.1016/j.minpro.2012.12.003. [DOI] [Google Scholar]
- Azgomi F.; Gomez C. O.; Finch J. A. Characterizing Frothers using Gas Hold-Up. Can. Metall. Q. 2007, 46 (3), 237–242. 10.1179/cmq.2007.46.3.237. [DOI] [Google Scholar]
- Laskowski J. S.; Tlhone T.; Williams P.; Ding K. Fundamental properties of the polyoxypropylene alkyl ether flotation frothers. Int. J. Miner. Process. 2003, 72 (1–4), 289–299. 10.1016/S0301-7516(03)00105-4. [DOI] [Google Scholar]
- Rafiei A. A.; Robbertze M.; Finch J. A. Gas holdup and single bubble velocity profile. Int. J. Miner. Process. 2011, 98 (1–2), 89–93. 10.1016/j.minpro.2010.10.011. [DOI] [Google Scholar]
- Corona-Arroyo M. A.; López-Valdivieso A.; Laskowski J. S.; Encinas-Oropesa A. Effect of frothers and dodecylamine on bubble size and gas holdup in a downflow column. Miner. Eng. 2015, 81, 109–115. 10.1016/j.mineng.2015.07.023. [DOI] [Google Scholar]
- Leiva J.; Vinnett L.; Contreras F.; Yianatos J. Estimation of the actual bubble surface area flux in flotation. Miner. Eng. 2010, 23 (11), 888–894. 10.1016/j.mineng.2010.01.013. [DOI] [Google Scholar]
- Finch J. A.; Xiao J.; Hardie C.; Gomez C. O. Gas dispersion properties: bubble surface area flux and gas holdup. Miner. Eng. 2000, 13 (4), 365–372. 10.1016/S0892-6875(00)00019-4. [DOI] [Google Scholar]
- Schwarz S.; Alexander D. Gas dispersion measurements in industrial flotation cells. Miner. Eng. 2006, 19 (6), 554–560. 10.1016/j.mineng.2005.09.022. [DOI] [Google Scholar]
- Sultan A. J.; Sabri L. S.; Al-Dahhan M. H. Impact of heat-exchanging tube configurations on the gas holdup distribution in bubble columns using gamma-ray computed tomography. Int. J. Multiphase Flow. 2018, 106, 202–219. 10.1016/j.ijmultiphaseflow.2018.05.006. [DOI] [Google Scholar]
- Weng L.; Zhang J.; Zhang W. An Ultrasound-Conductivity Method for Measuring Gas Holdup in a Microbubble-Based Gas-Liquid System. Can. J. Chem. Eng. 2018, 96 (4), 1005. 10.1002/cjce.23025. [DOI] [Google Scholar]
- Bhunia K.; Kundu G.; Mukherjee D. Gas holdup characteristics in a flotation column with different solids. Sep. Sci. Technol. 2017, 52 (7), 1298–1309. 10.1080/01496395.2017.1287196. [DOI] [Google Scholar]
- Sasaki S.; Hayashi K.; Tomiyama A. Effects of liquid height on gas holdup in air–water bubble column. Exp. Therm Fluid Sci. 2016, 72, 67–74. 10.1016/j.expthermflusci.2015.10.027. [DOI] [Google Scholar]
- Maldonado M.; Gomez C. O. A new approach to measure gas holdup in industrial flotation machines part I: Demonstration of working principle. Miner. Eng. 2018, 118, 1–8. 10.1016/j.mineng.2018.01.001. [DOI] [Google Scholar]
- Ravichandran V.; Eswaraiah C.; Sakthivel R.; Biswal S. K.; Manisankar P. Gas dispersion characteristics of flotation reagents. Powder Technol. 2013, 235, 329–335. 10.1016/j.powtec.2012.10.039. [DOI] [Google Scholar]
- Panjipour R.; Karamoozian M.; Albijanic B. Investigations of gas holdup, interfacial area of bubbles and bubble size distributions in a pilot plant flotation column. Miner. Eng. 2021, 164, 106819. 10.1016/j.mineng.2021.106819. [DOI] [Google Scholar]
- Gorain B. K.; Franzidis J. P.; Manlapig E. V. Studies on impeller type, impeller speed and air flow rate in an industrial scale flotation cell. Part 4: Effect of bubble surface area flux on flotation performance. Miner. Eng. 1997, 10 (4), 367–379. 10.1016/S0892-6875(97)00014-9. [DOI] [Google Scholar]
- Vinnett L.; Contreras F.; Yianatos J. Gas dispersion pattern in mechanical flotation cells. Miner. Eng. 2012, 26, 80–85. 10.1016/j.mineng.2011.11.003. [DOI] [Google Scholar]
- Uçurum M. Influences of Jameson flotation operation variables on the kinetics and recovery of unburned carbon. Powder Technol. 2009, 191 (3), 240–246. 10.1016/j.powtec.2008.10.014. [DOI] [Google Scholar]
- Ding G.; Chen J.; Li Z.; Cai X. Numerical Simulation on the Motion and Breakup Characteristics of a Single Bubble in a Venturi Channel. Ind. Eng. Chem. Res. 2021, 60 (40), 14613–14624. 10.1021/acs.iecr.1c02567. [DOI] [Google Scholar]
- Şahbaz O.; Uçar A.; Öteyaka B.; Taş O. Ö.; Özdemir O. Separation of colemanite from tailings using the pilot scale flotation column. Powder Technol. 2017, 309, 31–36. 10.1016/j.powtec.2016.12.077. [DOI] [Google Scholar]
- Li N.; Li Y.; Fu X.; Gao F.; Zhang C.; Xia W.; Liang L. Flotation kinetics of coal in the Inflatable Cyclonic Flotation Column. Powder Technol. 2018, 335, 204–210. 10.1016/j.powtec.2018.05.028. [DOI] [Google Scholar]
- Prakash R.; Majumder S. K.; Singh A. Flotation technique: Its mechanisms and design parameters. Chem. Eng. Process. - Process Intensificat. 2018, 127, 249–270. 10.1016/j.cep.2018.03.029. [DOI] [Google Scholar]
- Han Y.; Zhu J.; Shen L.; Zhou W.; Ling Y.; Yang X.; Wang S.; Dong Q. Bubble Size Distribution Characteristics of a Jet-Stirring Coupling Flotation Device. Minerals. 2019, 9 (6), 369. 10.3390/min9060369. [DOI] [Google Scholar]
- Han Y.; Zhu J.; Fei Z.; Zhou W.; Wang C.; Zhu Z.; Shen L. Suction capacity of annular jet flotation device. J. China Univ. Min. Technol. 2019, 48 (3), 633–639. [Google Scholar]
- Beltaos S.; Rajaratnam N. Plane turbulent impinging jets. Journal of Hydraulic Research. 1973, 11 (1), 29–59. 10.1080/00221687309499789. [DOI] [Google Scholar]
- Zhu H.; Zhu J.; Min F.; Valdivieso A. L.; Corona Arroyo M. A.; Wang H. Effect of frother addition mode on coal flotation in downflow flotation column. J. Cleaner Prod. 2021, 278, 123844. 10.1016/j.jclepro.2020.123844. [DOI] [Google Scholar]
- Elmahdy A. M.; Finch J. A. Effect of frother blends on hydrodynamic properties. Int. J. Miner. Process. 2013, 123, 60–63. 10.1016/j.minpro.2013.04.019. [DOI] [Google Scholar]
- Tavera F. J.; Escudero R.; Finch J. A. Gas holdup in flotation columns: laboratory measurements. Int. J. Miner. Process. 2001, 61 (1), 23–40. 10.1016/S0301-7516(00)00026-0. [DOI] [Google Scholar]
- Gordiychuk A.; Svanera M.; Benini S.; Poesio P. Size distribution and Sauter mean diameter of micro bubbles for a Venturi type bubble generator. Exp. Therm Fluid Sci. 2016, 70, 51–60. 10.1016/j.expthermflusci.2015.08.014. [DOI] [Google Scholar]
- Wang G.; Evans G. M.; Jameson G. J. Bubble–particle detachment in a turbulent vortex I: Experimental. Miner. Eng. 2016, 92, 196–207. 10.1016/j.mineng.2016.03.011. [DOI] [Google Scholar]
- Mesa D.; Morrison A. J.; Brito-Parada P. R. The effect of impeller-stator design on bubble size: Implications for froth stability and flotation performance. Miner. Eng. 2020, 157, 106533. 10.1016/j.mineng.2020.106533. [DOI] [Google Scholar]
- Wang G.; Nguyen A. V.; Mitra S.; Joshi J. B.; Jameson G. J.; Evans G. M. A review of the mechanisms and models of bubble-particle detachment in froth flotation. Sep. Purif. Technol. 2016, 170, 155–172. 10.1016/j.seppur.2016.06.041. [DOI] [Google Scholar]
- Sovechles J. M.; Lepage M. R.; Johnson B.; Waters K. E. Effect of gas rate and impeller speed on bubble size in frother-electrolyte solutions. Miner. Eng. 2016, 99, 133–141. 10.1016/j.mineng.2016.08.021. [DOI] [Google Scholar]
- Chu P.; Waters K. E.; Finch J. A. Break-up in formation of small bubbles: Comparison between low and high frother concentrations. Miner. Eng. 2016, 96–97, 15–19. 10.1016/j.mineng.2016.06.002. [DOI] [Google Scholar]
- Chen Z.; Ata S.; Jameson G. J. Behaviour of bubble clusters in a turbulent flotation cell. Powder Technol. 2015, 269, 337–344. 10.1016/j.powtec.2014.09.025. [DOI] [Google Scholar]
- Shahbazi B.; Rezai B.; Koleini S. M. J.; Noaparast M. The Empirical Prediction of Gas Dispersion Parameters on Mechanical Flotation Cells. Engineering 2012, 4 (1), 11–17. 10.4236/eng.2012.41003. [DOI] [Google Scholar]
- Kourunen J.; Niitti T.; Heikkinen L. M. Application of three-dimensional electrical resistance tomography to characterize gas holdup distribution in laboratory flotation cell. Miner. Eng. 2011, 24 (15), 1677–1686. 10.1016/j.mineng.2011.09.004. [DOI] [Google Scholar]
- Basavarajappa M.; Miskovic S. CFD simulation of single-phase flow in flotation cells: Effect of impeller blade shape, clearance, and Reynolds number. International Journal of Mining Science and Technology 2019, 29 (5), 657–669. 10.1016/j.ijmst.2019.05.001. [DOI] [Google Scholar]
- Zhang W.; Zhou X.; Finch J. A. Determining independent control of dual-frother systems – Gas holdup, bubble size and water overflow rate. Miner. Eng. 2012, 39, 106–116. 10.1016/j.mineng.2012.08.008. [DOI] [Google Scholar]
- Li X.; Zhu W.; Liu J.; Zhang J.; Xu H.; Deng X. Gas holdup in cyclone-static micro-bubble flotation column. Environ. Technol. 2016, 37 (7), 785–94. 10.1080/09593330.2015.1085098. [DOI] [PubMed] [Google Scholar]
- Shukla S. C.; Kundu G.; Mukherjee D. Study of gas holdup and pressure characteristics in a column flotation cell using coal. Miner. Eng. 2010, 23 (8), 636–642. 10.1016/j.mineng.2010.03.005. [DOI] [Google Scholar]
- Yianatos J.; Contreras F.; Díaz F. GAS holdup and RTD measurement in an industrial flotation cell. Miner. Eng. 2010, 23 (2), 125–130. 10.1016/j.mineng.2009.11.003. [DOI] [Google Scholar]