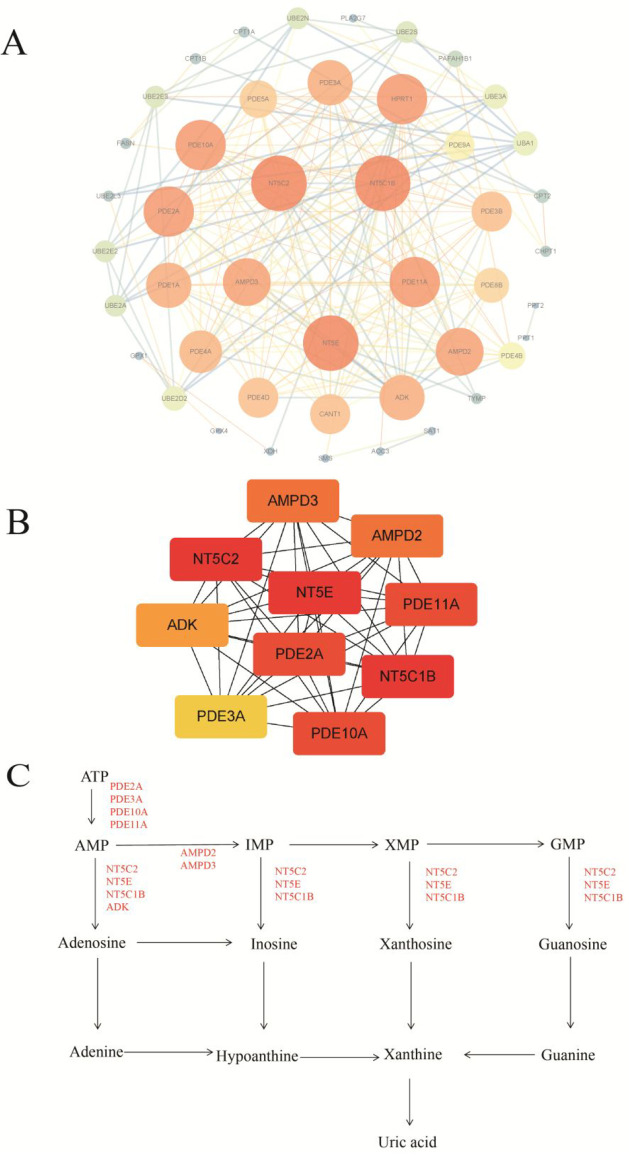
Figure 10.
Protein–protein interaction (PPI) analysis of the key targets. (A) PPI network of the shared targets and (B) the network of the protein targets with the top ten MCC values in the interaction network. (C) The position of the top ten targets in purine metabolism. For the interpretation of the references to color in this figure legend, the reader is referred to the web version of this article.

