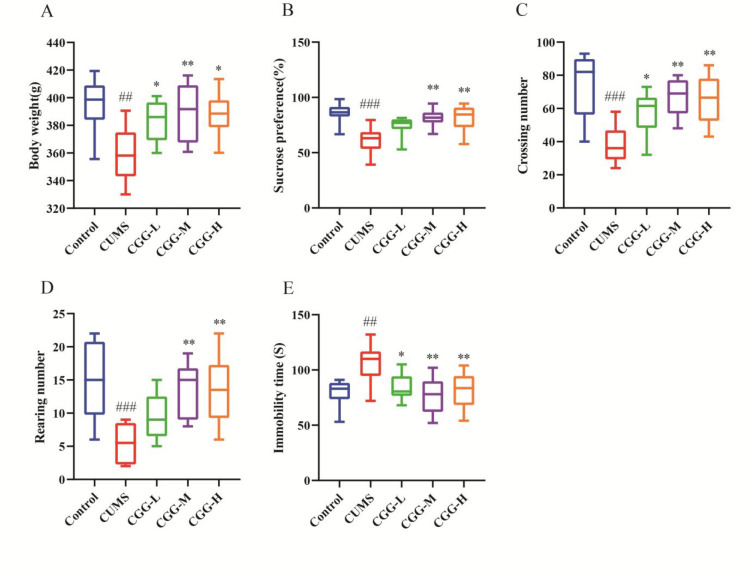
Figure 2.
Evaluation of the antidepressant effect of Chaigui granules. (A) Rat body weights on day 28. (B) Sucrose preference. (C) The crossing number in the open field test (OFT). (D) The rearing number in the OFT. (E) Immobility time in the forced swimming test (FST). All data are expressed as the median ± min to max (n = 8). #P < 0.05, ##P < 0.01, and ###P < 0.001 compared with control group. *P < 0.05, **P < 0.01, and ***P < 0.001 compared with the CUMS group. CUMS is the the model group, CGG-L is the group that received a low dose of Chaigui granules, CGG-M is the group that received a medium dose of Chaigui granules, and CGG-H is the group that received the high dose of Chaigui granules.

