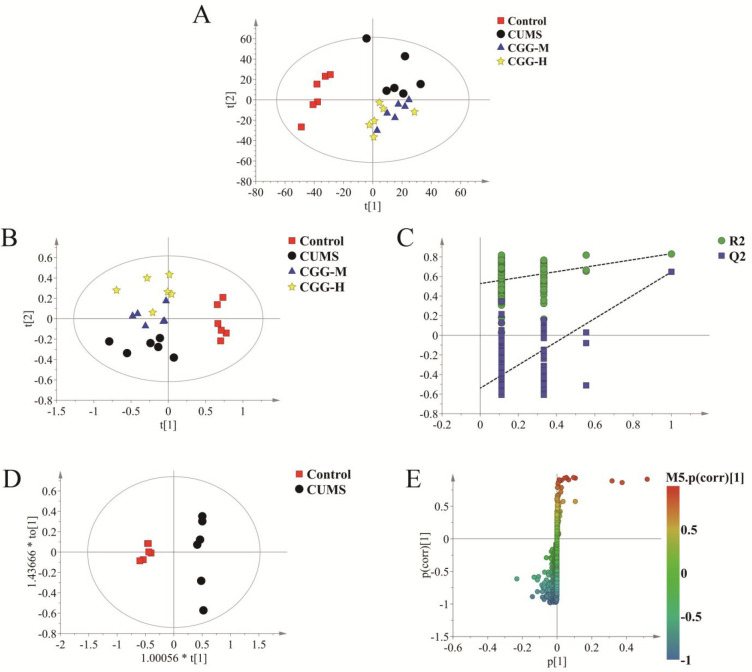
Figure 5.
Metabolomics profiling analysis of PBMCs. (A) PCA score plot, (B) PLS-DA score plot, (C) PLS-DA validation plot, (D) OPLS-DA score plot, and (E) S-plot of OPLS-DA. CUMS is the model group, CGG-M is the group that received the medium dose of Chaigui granules, and CGG-H is the group that received the high dose of Chaigui granules.

