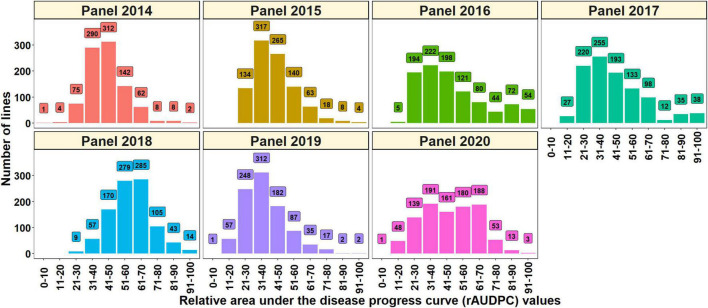
FIGURE 1.
Distribution of the spot blotch relative area under the disease progress curve (rAUDPC) values in panel 2014 (904 lines), panel 2015 (949 lines), panel 2016 (990 lines), panel 2017 (1,011 lines), panel 2018 (962 lines), panel 2019 (943 lines), and panel 2020 (977 lines) during the 2014, 2015, 2016, 2017, 2018, 2019, and 2020 evaluations, respectively.

